Research before product: how Indian markets work, which claims survive the data, and where rules and systems stop.
AION Analytics is an infrastructure deeptech company. The dashboard and APIs are distribution surfaces for deeper work, published here in eight series: option chains and dealer hedging, tested market claims, trader behaviour and process, macro and geoeconomics, intelligence infrastructure (AION Indian Market Intelligence), market rules and investor records, cybersecurity and AI safety, and models with their public validation records.
Contents
- Option Chains and Dealer Hedging: How Indian Index Prices Are Made
- Tested Market Claims: Popular Beliefs Checked Against NIFTY Data
- Trader Behaviour and Process: Why a Correct View Can Still Lose Money
- Macro and Geoeconomics: How Outside Events Reach Indian Markets
- Intelligence Infrastructure: AION Indian Market Intelligence
- Market Rules and Investor Records: What Regulation Covers and Where It Stops
- Cybersecurity and AI Safety: Gaps in Detection and Safeguards
- Models, Maths and Public Validation Records
- Topics and keywords, by series
- SSRN papers: full citations and BibTeX
- Chronological index of all notes
Option Chains and Dealer Hedging: How Indian Index Prices Are Made
How prices are made in Indian index futures and options: who holds which position, how option writers hedge, and what open interest, volatility and the opening and closing auctions do and do not tell you. For retail F&O participants, and for anyone who wants to read an option chain without mistaking it for a forecast.
Why Max Pain Matters (And When It Doesn't)
Educational note | AION Research Notes | October 8, 2026
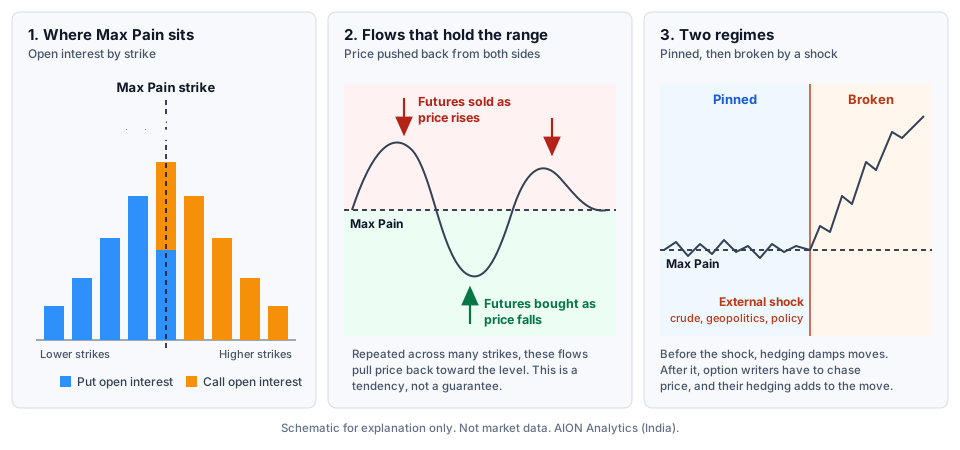
Explains what the Max Pain level is, how it is computed from open interest, why price sometimes drifts toward it before expiry, and why an outside shock turns the same hedging into fuel for the move.
- Works through a three-strike example so the arithmetic can be checked by hand.
- Treats Max Pain as a tendency that depends on distance from spot, the put-call ratio, and India VIX.
- States plainly which figures are rules of thumb and not tested results.
Diagram: Three panels: open interest by strike with the Max Pain strike marked, the flows that hold price near it, and a price path that is pinned and then broken by an outside shock. View diagram →Read note →
Gamma Squeeze Mechanics: Why Dealers Accelerate Their Own Pain
Educational note | AION Research Notes | October 8, 2026
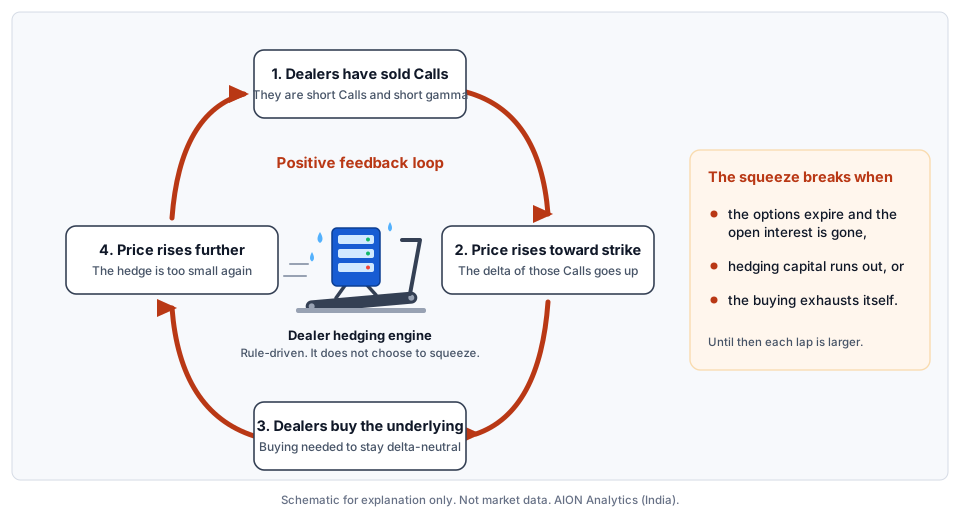
Walks through the hedging loop behind a gamma squeeze: short Calls, rising delta, forced buying, and a higher price that forces more buying. Explains why the index version looks different from a single-stock squeeze.
- Shows with a small numerical example why the required hedge grows as price rises.
- Lists the conditions that make a squeeze more likely and the three ways it ends.
- States the limit of every dealer-gamma estimate: exchange data does not show who holds which side.
Diagram: A four-step loop from sold Calls to forced buying, with the dealer hedging engine in the centre and the three ways the squeeze ends. View diagram →Read note →
The Gamma Flip: When Dealers Stop Damping and Start Amplifying
Educational note | AION Research Notes | October 8, 2026
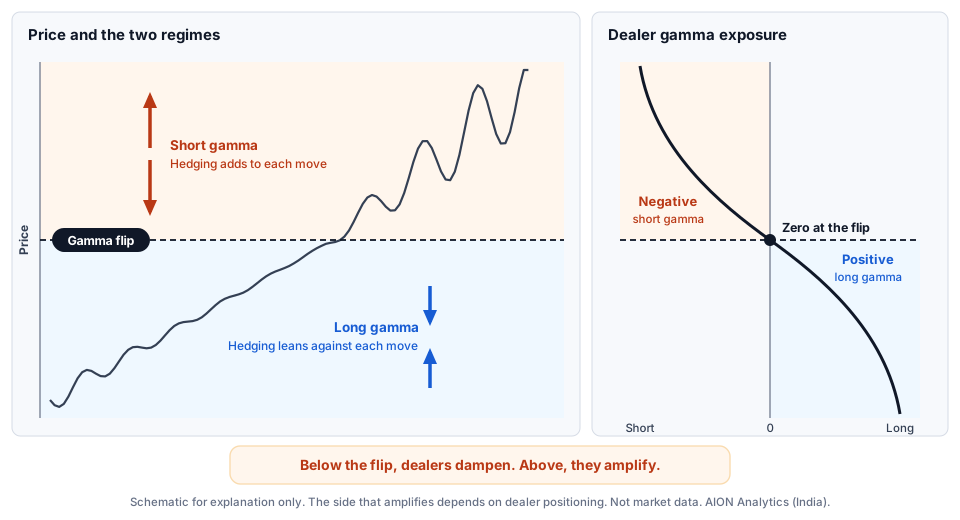
Explains the price at which dealer hedging changes from damping moves to amplifying them, and why the same market can grind on one side of that level and accelerate on the other.
- Sets out the two states, long gamma and short gamma, and the hedging each one forces.
- Links the pin in the Max Pain note to the loop in the Gamma Squeeze note as two sides of one level.
- States that the flip is an estimate, and that which side amplifies depends on dealer positioning.
Diagram: Price on each side of the gamma flip, with dealer gamma exposure crossing zero at that level. View diagram →Read note →
The VIX Crush: Why Your Option Loses Value Even When You Are Right
Educational note | AION Research Notes | October 8, 2026
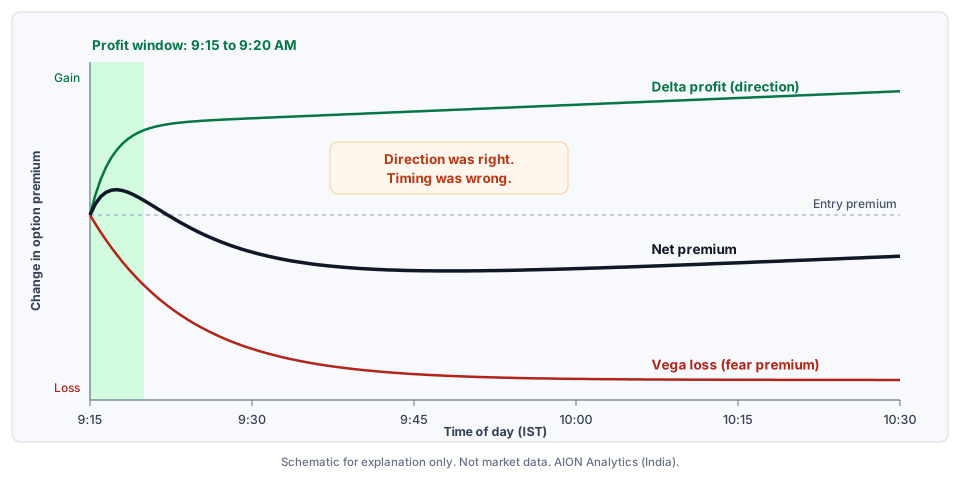
Explains why a Put can lose value on a morning when the market falls. The premium contains a price for uncertainty, and that price drops once the open has resolved the uncertainty.
- Splits the premium change into a delta part and a vega part with a small numerical example.
- Shows why the window for a directional option trade at the open is short.
- Treats the IV levels of 20 and 14 as rules of thumb, not tested thresholds.
Diagram: Delta profit, vega loss and net premium from 9:15 AM to 10:30 AM, with the short profit window shaded. View diagram →Read note →
Open Interest Is Not a Forecast: It Is a Map of Trapped Positions
Educational note | AION Research Notes | October 8, 2026
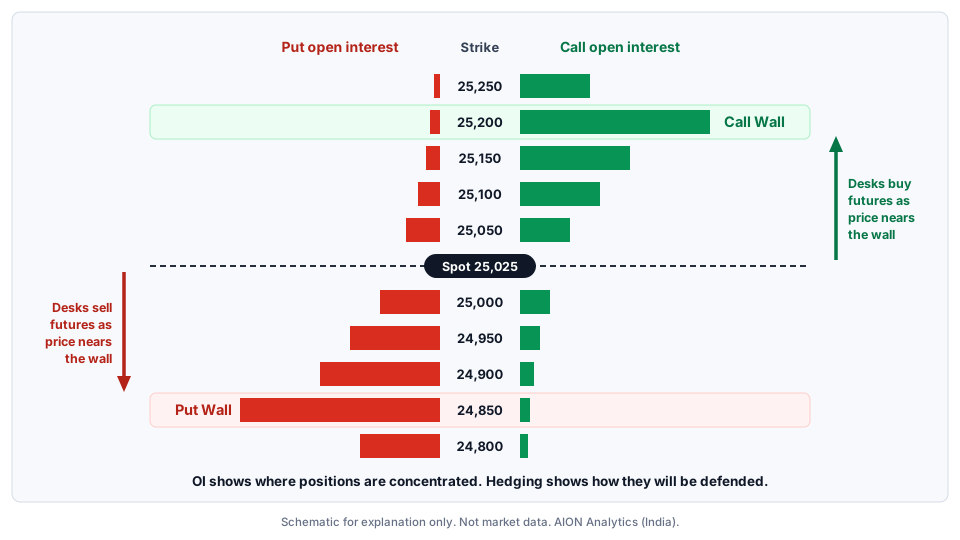
Reads the option chain as a map of where positions sit, not as a prediction. Explains Call walls, Put walls, and the hedging that follows when spot moves toward them.
- Separates the hedging tailwind on the way to a wall from the defence of the wall itself.
- Names three readings: the Call to Put ratio by strike, the rate of change in open interest, and the distance from spot.
- States the limit of the method: open interest does not identify the buyer or the writer.
Diagram: Put and Call open interest by strike around spot, with the Call Wall, the Put Wall and the hedging flows toward each. View diagram →Read note →
The OI-to-Price Divergence: When Open Interest and Spot Disagree
Educational note | AION Research Notes | October 8, 2026
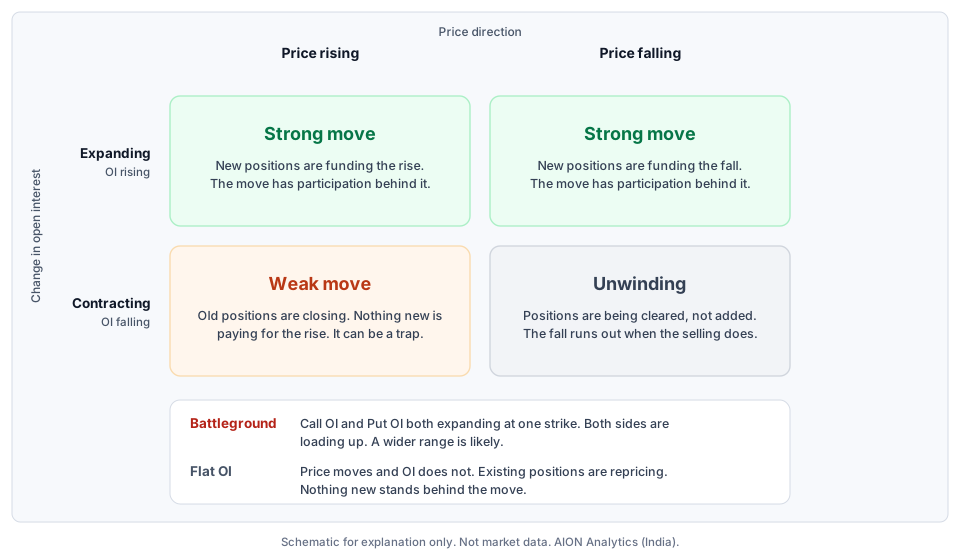
Explains what the change in open interest says about a price move: whether new positions are paying for it, old positions are closing, or both sides are loading up at the same strike.
- Separates a move on expanding open interest from one on flat or contracting open interest.
- Describes the battleground strike, the clearing-out, and the quiet build-up on the Put side that can precede a pin.
- States that these are readings, not tested signals, and that open interest does not say who is buying.
Diagram: A two by two grid of price direction against the change in open interest, with the battleground and flat cases below it. View diagram →Read note →
Expiry Week Mechanics: Why Tuesday Is Not Like Friday
Educational note | AION Research Notes | October 8, 2026
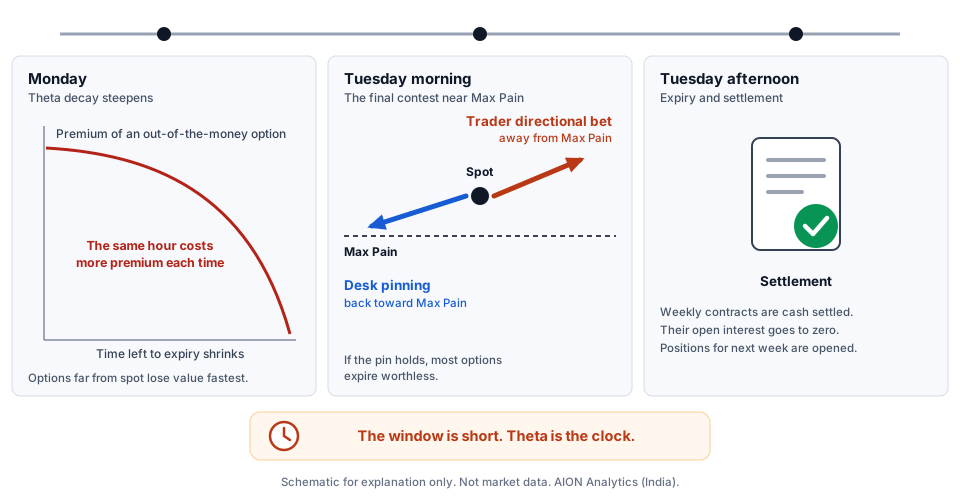
Follows a Nifty weekly contract through its last two sessions: faster time decay on Monday, the contest around Max Pain on Tuesday morning, and cash settlement on Tuesday afternoon.
- Explains why an option held into expiry week is a bet on timing as well as direction.
- Names three readings: theta on the chain, spot against Max Pain on Monday, and the change in open interest on Tuesday morning.
- Notes that the expiry day is set by the exchange and can change.
Diagram: A timeline of Monday, Tuesday morning and Tuesday afternoon: steepening theta decay, the contest around Max Pain, and settlement. View diagram →Read note →
The Multi-Asset Cross-Hedge: Why Crude Moves Nifty
Educational note | AION Research Notes | October 8, 2026
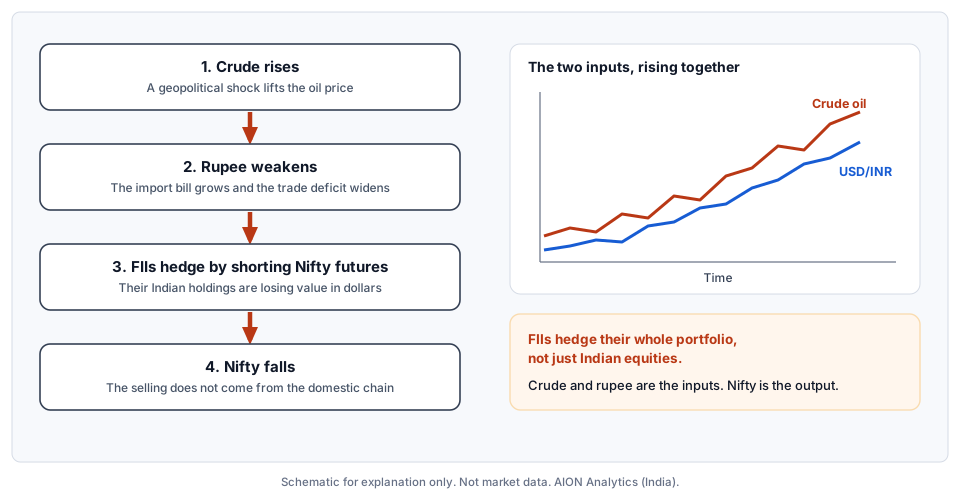
Traces the chain from a rise in crude oil to a fall in Nifty through the rupee and the hedging of foreign institutional investors, and explains why this flow ignores domestic option levels.
- Sets out the chain one link at a time: crude, import bill, rupee, foreign hedging, Nifty.
- Explains why a global desk does not look at Indian Max Pain.
- Lists the cases where the chain does not hold.
Diagram: A four-step flow from crude oil to Nifty, with crude and USD/INR rising together in a side panel. View diagram →Read note →
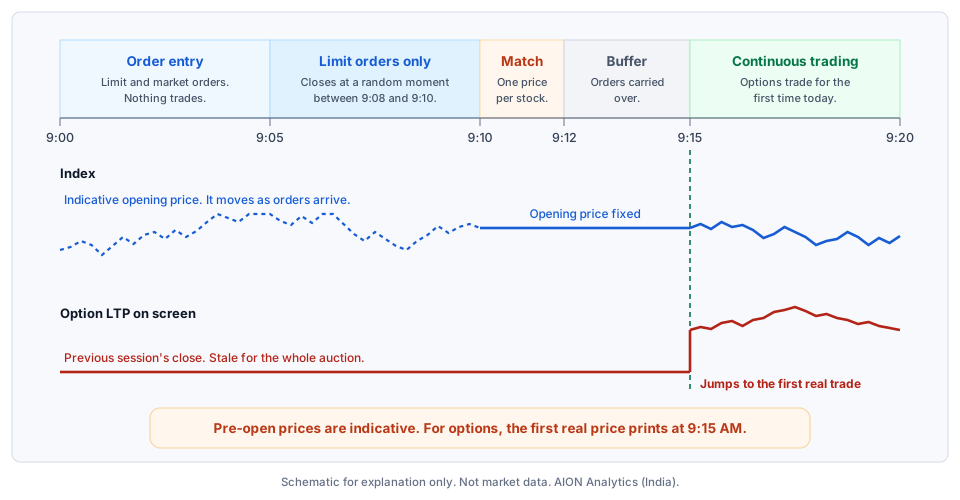
The Pre-Open Auction: Why 9:00 to 9:15 AM Prices Lie
Educational note | AION Research Notes | October 8, 2026
Explains what the screen shows between 9:00 and 9:15 AM: an indicative index price while orders are collected, one matched opening price, and option prices that stay at the previous close until the first trade.
- Sets out the stages of the pre-open session with the times in force since September 7, 2026.
- Shows why an option price or India VIX reading seen at 9:05 AM is stale.
- Notes that session timings are set by the exchange and can change.
Diagram: A timeline from 9:00 to 9:20 AM showing order collection, the single match, the buffer and the first real option trade at 9:15 AM. View diagram →Read note →
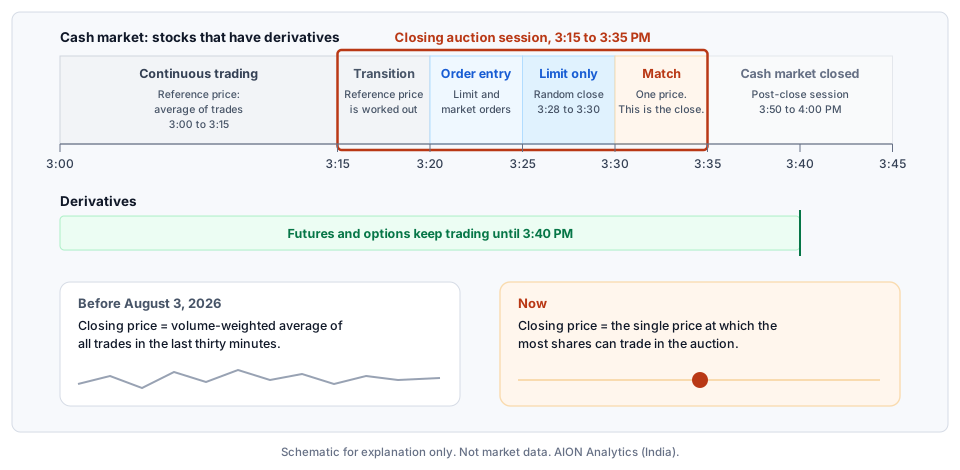
The Closing Auction: How the Close Is Set Since August 2026
Educational note | AION Research Notes | October 8, 2026
Explains the closing auction session that sets the closing price of stocks with derivatives since August 3, 2026: its stages, its price band, and why index expiry now settles against an auction price.
- Sets out the session from 3:15 to 3:35 PM stage by stage, from the SEBI circular.
- Compares the old closing price, an average of the last thirty minutes, with the new single auction price.
- States what the circular says about settlement prices and what it leaves to later procedures.
Diagram: A timeline from 3:00 to 3:45 PM with the closing auction session marked, and the old and new ways of forming a closing price side by side. View diagram →Read note →
The FII-DII Headline Is Lagging: What Actually Moved the Market on April 8
Market structure note | AION Research Notes | June 22, 2026
On April 8, 2026, FIIs net-sold ₹8,692 crore in cash equities, yet Nifty gained ~3.85%. This note explains the three layers the daily FII-DII number structurally cannot see.
- FII index-futures positioning is often the larger and more structurally informative exposure than the cash-equity headline.
- India VIX compression, the volatility regime repricing, frequently drives the speed and breadth of a rally more than any single flow figure.
- The combined domestic bid (DII + retail + SIP + proprietary) has become structurally large enough in 2025-26 to absorb sustained FII selling.
Options Greeks Through Taylor Series
Educational note | AION Research Notes | June 1, 2026
Breaks down nonlinear option movement into delta, gamma, and theta so readers can see why the same index move does not create the same option-price move every time.
- Delta shows first-order price sensitivity.
- Gamma explains why at-the-money options can accelerate after the first move.
- Theta grounds the constant time-decay pressure that infrastructure must account for.
Tested Market Claims: Popular Beliefs Checked Against NIFTY Data
Claims that circulate among traders, stated as precisely as possible and tested on NIFTY 50 data. Each note gives the claim, the data, the method, the result, what the test cannot see, and the script to rerun it. A claim that fails is reported as failed. For traders who want evidence before a rule of thumb, and for researchers who want to check the work.
The Day After Expiry: Testing the Morning Rally and Fade on NIFTY
Tested claim | AION Research Notes | October 22, 2026
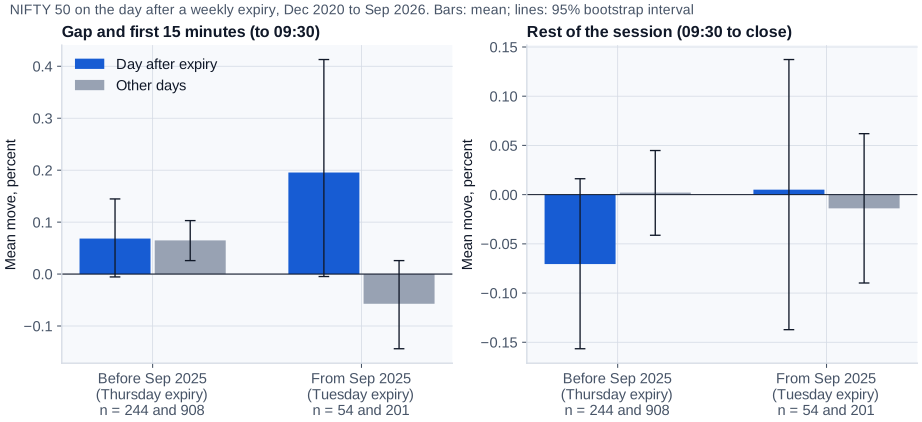
Tests the claim that rollover buying lifts NIFTY in the first fifteen minutes after a weekly expiry and that the rise fades by the close, on 1,407 trading days from December 2020 to September 2026.
- The fade does not appear in either the Thursday or the Tuesday expiry period.
- The higher opening since Tuesday expiry cannot be told apart from an ordinary Wednesday effect.
- Explains why the stated mechanism does not match how index options settle.
Diagram: Mean opening and rest-of-session moves on days after expiry against other days, with 95 percent intervals, in both expiry periods. View diagram →Read note →
Quarter-End Window Dressing: Testing the Claim on NIFTY
Tested claim | AION Research Notes | October 22, 2026
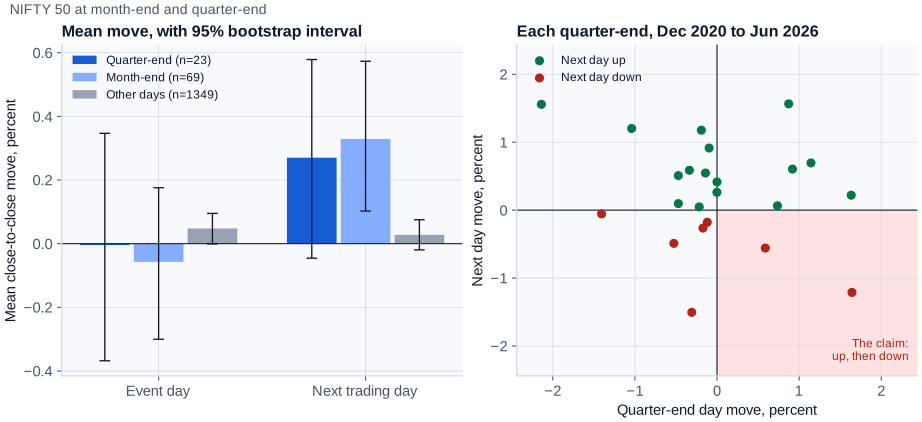
Tests the claim that institutions lift the index on the last day of a quarter and that it falls back the next day, against what the literature on window dressing actually finds.
- NIFTY closed up on 7 of 23 quarter-ends; the next day was up on 16 of 23.
- The rise-then-fall sequence occurred twice in 23 quarters.
- A turn-of-the-month rise does appear, and is reported as found.
Diagram: Mean moves around month-ends and quarter-ends, and one point per quarter-end against the claimed pattern. View diagram →Read note →
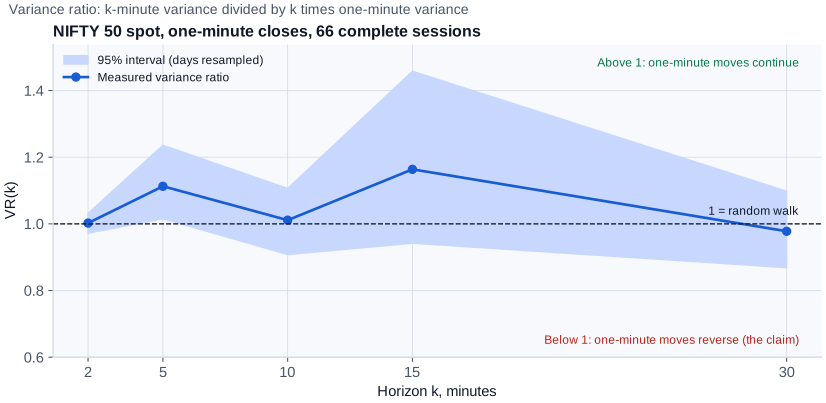
Are One-Minute NIFTY Candles Mostly Noise? A Variance Ratio Test
Tested claim | AION Research Notes | October 22, 2026
Tests the claim that one-minute index candles are dominated by noise whose moves reverse, with a variance ratio test on 66 complete sessions of NIFTY 50 spot data.
- No horizon from 2 to 30 minutes shows the reversal the claim predicts.
- Explains why a single futures or options order cannot print in the spot index.
- States what the test cannot see: futures and option candles.
Diagram: Variance ratio of one-minute NIFTY 50 returns at five horizons, with a 95 percent interval and the random-walk line. View diagram →Read note →
Trader Behaviour and Process: Why a Correct View Can Still Lose Money
How decisions go wrong even when the reading of the market is right: fear and confirmation bias, traps that punish the obvious reaction, scoreboards that mix unrelated positions, and the case for staying out. For retail participants, and for anyone who designs the screens they trade from.
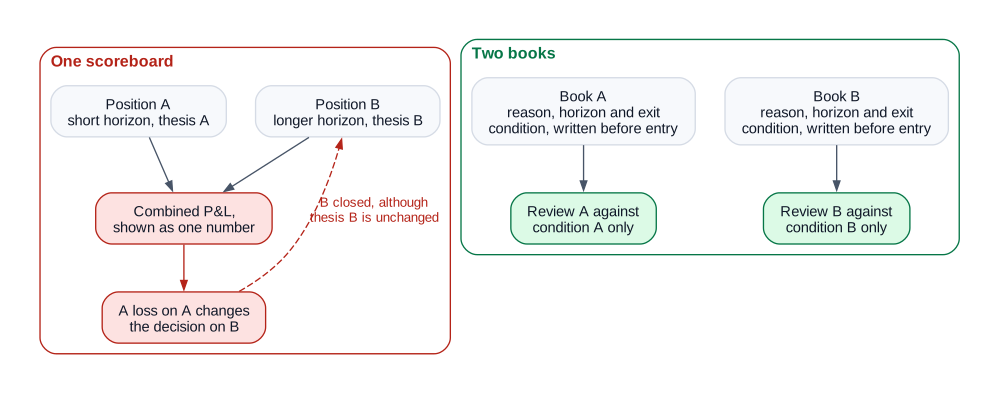
One Scoreboard, Two Books: How a Combined P&L Distorts Decisions
Educational note | AION Research Notes | October 22, 2026
Shows how one profit-and-loss number for positions held for different reasons lets a loss on one change the decision on another, and what the behavioural finance literature says about it.
- Mental accounting, narrow framing, loss aversion and the disposition effect, with sources.
- Separation as a matter of record keeping: reason, horizon and exit condition written before entry.
- No rule is recommended and none is tested.
Diagram: A combined scoreboard against separate books, each reviewed against its own condition. View diagram →Read note →
When F&O Is Not for You
Educational note | AION Research Notes | October 8, 2026
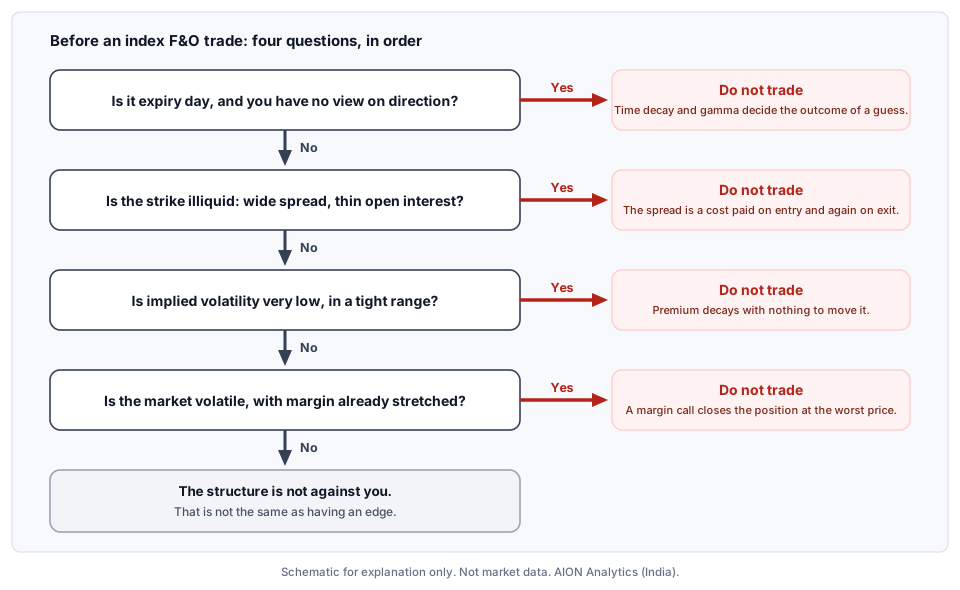
Names four conditions in which the structure of index F&O works against a retail participant, and explains the mechanism behind each: expiry day without a view, illiquid strikes, very low implied volatility, and stretched margin in a volatile market.
- Starts from SEBI's own findings on how individual F&O traders have fared.
- Gives the mechanism for each condition, not a rule to memorise.
- Ends with a four-question check and says plainly that passing it is not an edge.
Diagram: A decision tree of four questions, each with a "do not trade" branch and its reason. View diagram →Read note →
High VIX Trap: Why Market Fear Becomes a Siren Song
Educational note | AION Research Notes | March 18, 2026
Explains why a rising India VIX signals expected swing magnitude, not directional edge, and why high option premiums can become bait for undisciplined F&O traders.
- Separates volatility magnitude from price direction.
- Frames sharp VIX spikes as panic overshoots that require stricter risk controls.
Bull Traps, Bear Traps, and Emotional Confirmation Bias
Educational note | AION Research Notes | May 26, 2026
Connects failed breakouts, reversals, option-writer behavior, liquidity sweeps, VIX, and volume follow-through to behavioral risk.
- Moves the explanation from candle labels to market-participation evidence.
- Emphasizes confirmation over excitement in high-volatility regimes.
The Bear Trap: How Panic Shorts Get Squeezed
Educational note | AION Research Notes | May 26, 2026
A bear trap is a move below support that draws in panic sellers and short sellers and then reverses sharply upward. It is the mirror image of the bull trap.
- Sets out the mechanics of the break below support and the reversal.
- Explains how short covering amplifies the move back up.
- Lists the conditions to check before treating a breakdown as real.
15-Minute Opening-Window Rule
Educational note | AION Research Notes | May 10, 2026
A market-structure entry framework: let the first 15 minutes define the opening range, mark high/low/VWAP, then wait for breakout, retest, and volume confirmation.
- Avoids first-candle impulse entries.
- Filters midpoint chop by waiting for confirmation instead of guessing.
Your Trading Car: A Minimalist Dashboard for Decisions
Educational note | AION Research Notes | February 12, 2026
Reduces chart clutter into four gauges: price/trend, volume/participation, momentum, and key levels, so decisions move from opinions to evidence.
- Uses VWAP/MA as the speedometer for direction.
- Explains why conflicting gauges often mean no trade is the cleanest decision.
Macro and Geoeconomics: How Outside Events Reach Indian Markets
The larger forces that sit behind market moves: capital flows, industrial policy, resource security, state capacity, and the distance between headline growth numbers and how households actually live. This work is for readers who want the economic setting before the trade, including students, policy readers and long-term investors.
Asymmetric Multipolarity: Financial, Industrial, Resource, and Strategic Power in the Post-Unipolar Global Order
Gupta, Lokesh. SSRN, 2026. DOI: 10.2139/ssrn.6449739
A geoeconomic framework for reading the post-unipolar order through financial depth, industrial capacity, resource security and strategic autonomy.
Read on SSRN → DOI Full citation and BibTeX ↓The Great Indian Illusion: Unpacking the Gap Between Growth Statistics and Citizen Well-Being
Gupta, Lokesh. SSRN, 2026. DOI: 10.2139/ssrn.6973958
Headline indicators of the Indian economy can be accurate and incomplete at the same time. This paper examines the gap between growth aggregates and citizen well-being using primary data available as of June 2026.
Read on SSRN → DOI Full citation and BibTeX ↓The Great Indian Illusion: Five Structural Cracks
Educational note | AION Research Notes | April 9, 2026
A plain-language macro framework contrasting headline growth narratives with lived indicators: wages, jobs, grocery costs, credit access, the rupee, and public services.
- Connects economic statistics to household-level stress signals.
- Frames questions retail participants can ask before accepting headline narratives.
The Great Indian Illusion, Part 2: When the Framework Made a Call
Educational note | AION Research Notes | May 17, 2026
A follow-up to the Great Indian Illusion. It revisits the five structural cracks 40 days later and examines why India's leadership discouraged gold purchases as a macro policy signal.
- Compares what the framework said with what happened.
- Examines what gold purchasing signals and why the government discouraged it.
- States the forward implication of the framework.
Crash Cycles Before the Headline Trigger
Educational note | AION Research Notes | May 21, 2026
Explains that most crashes are prepared by leverage, liquidity stress, crowded positioning, debt, and overconfidence before one headline appears to cause the break.
- Separates slow structural fragility from the final visible catalyst.
- Maps directly to macro-event and sector-impact intelligence work.
Who Actually Lost in a Crash? Breaking the "₹16 Lakh Crore Wiped Out" Myth
Educational note | AION Research Notes | March 5, 2026
Every crash produces the headline that lakhs of crores were wiped out. Money does not vanish in a crash. It changes hands, and the broker, the exchange and the government collect on every transaction in both directions.
- Unpacks the claim behind the headline figure.
- Names the four entities that always collect.
- Draws the implication for how a retail participant takes part.
The Dollar-Metals Dynamic: A Factual Framework
Educational note | AION Research Notes | January 2026
The inverse relationship between the US Dollar Index and precious metals is one of the most studied correlations in finance. The note records that in early 2026 it reached -96%, a level it counts only seven times since 1990, and explains the mechanics and what history suggests follows.
- Explains the core relationship between the dollar and precious metals.
- Shows why India is specifically exposed.
- Covers the geopolitical dimension of the 2026 reading.
Gold-Silver Ratio: A Dated Hypothesis (April 8, 2026)
Educational note | AION Research Notes | April 8, 2026
A dated research hypothesis on mean reversion in the gold-silver ratio, published with specific price data and a falsifiable prediction.
- Records the data snapshot of April 8, 2026.
- States the hypothesis and the prediction that would prove it wrong.
- Explains why AION dates and publishes its hypotheses.
Intelligence Infrastructure: AION Indian Market Intelligence
How AION Indian Market Intelligence turns one Indian financial or policy event into a structured reading of which sectors gain and which lose, through which channel and after what delay, and the research behind it. For developers using the IMI API, institutions evaluating it, and researchers working on country-specific decision systems.
Contextual Intelligence: A Causal Layer for Country-Specific Decisions
Gupta, Lokesh. SSRN, 2026. DOI: 10.2139/ssrn.7596079
General models supply language and reasoning but not the structure of a particular country. This paper describes a contextual layer that turns one economic event into a signed 32-sector incidence object: who gains, who loses, through which channel and after what delay. India is the first implementation; the system described is AION Indian Market Intelligence.
Read on SSRN → DOI Full citation and BibTeX ↓AION Indian Market Intelligence: Macro Event and Sector Impact API
Educational note | AION Research Notes | May 17, 2026
Explains the infrastructure gap where headlines are flattened into one label even though RBI, crude, monsoon, rupee, and policy shocks hit sectors through different channels.
- Maps macro events into sector vectors and stakeholder views.
- Shows why market intelligence needs Indian-sector mechanics, not generic sentiment labels.
Market Rules and Investor Records: What Regulation Covers and Where It Stops
How trading systems, brokers, regulators and investor records fit together, and where the rules leave a gap. The papers and notes here cover signal provenance, broker normalisation, static-IP rules for retail algorithms, what the Consolidated Account Statement does and does not show, and the information that stays outside formal records. For developers, compliance teams and regulators, and for investors who want to know what their records cover.
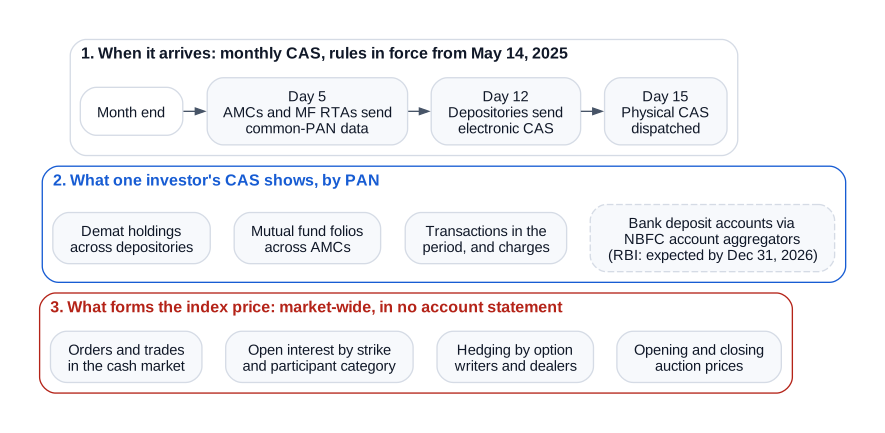
What the Consolidated Account Statement Shows, and What It Cannot
Regulatory note | AION Research Notes | October 22, 2026
Sets out what the CAS contains after SEBI's revised timelines of May 14, 2025 and the RBI's expected addition of bank deposits by December 31, 2026, and why it was never designed to show how prices are formed.
- Monthly and half-yearly timelines, checked against the SEBI circular.
- The RBI measure quoted from its October 7, 2026 statement, and marked as not yet in force.
- A side-by-side of account records and market data.
Diagram: The CAS timeline, what one investor's statement shows, and the market-wide information outside any account statement. View diagram →Read note →
Signal Provenance in Retail Algorithmic Trading: An Architectural Gap in SEBI's 2026 Framework and Its General Form
Gupta, Lokesh. SSRN, 2026. DOI: 10.2139/ssrn.7118421
SEBI's algorithmic trading framework closes the order chain but not the signal chain: a compliant order reaches the broker while what caused it remains invisible. The paper evidences that gap across India, the EU and the UAE and shows why origin capture is feasible.
Read on SSRN → DOI Full citation and BibTeX ↓The Uncodified Margin: Human Relational Intelligence as a Structural Complement to Algorithmic Systems in Five Emerging Markets
Gupta, Lokesh. SSRN, 2026. DOI: 10.2139/ssrn.7235801
Algorithmic systems can act only on information that has been codified. This paper names the decision-relevant information that remains outside formal records as the uncodified margin and examines why it persists in emerging-market commerce.
Read on SSRN → DOI Full citation and BibTeX ↓SEBI Governance Blind Spot on Static IP
Governance note | AION Research Notes | May 18, 2026
Frames retail algo execution as a governance and infrastructure problem around local agents, broker reporting, API-key custody, and static-IP assumptions.
- Contrasts institution-era static-IP architecture with retail-owned local execution.
- Supports the need for transparent governance layers around AI agents and broker APIs.
OpenAlgo symtoken: 31 Brokers and Multi-Broker Execution
Educational note | AION Research Notes | June 10, 2026
Explains how OpenAlgo normalizes order flow across 31 SEBI-registered brokers through canonical symbols and broker-specific token lookup, then shows why true multi-broker execution needs a retained cross-broker registry.
- Separates broker abstraction from UI glue by showing symbol, token, exchange, expiry, strike, and lot-size normalization as infrastructure work.
- Highlights the single-active-broker constraint where a shared symtoken table is replaced when the user switches brokers.
- Introduces AION's active retention approach: cache only the live signal universe with broker-specific mappings for instant switching, validation, and fan-out.
Cybersecurity and AI Safety: Gaps in Detection and Safeguards
Two papers on how protective systems fail. The Signature Trap is cybersecurity research: it examines why spyware detection built on known indicators reports nothing during the period that matters most, across fourteen attack vectors. Beyond the Mirror is AI safety research: a 90-day study of how the safeguards of large language models weaken under polite, persistent questioning. They are for security researchers, people at risk of targeted surveillance, and teams that build or test AI safeguards. This theme marks work beyond financial markets: security, data privacy, and the gaps that open when automation by AI meets systems people depend on.
The Signature Trap: Structural Gaps in Spyware Detection and the Limits of Indicator-Based Defense
Gupta, Lokesh. SSRN, 2026. DOI: 10.2139/ssrn.7503278
Signature-based spyware detection reports nothing during the exact window between an attack's first use and its first published indicator, so the absence of a match can never mean safety. This paper examines fourteen attack vectors and names the trust assumption that fails in each case.
Read on SSRN → DOI Full citation and BibTeX ↓Beyond the Mirror: Systemic Vulnerabilities in LLM Safeguards Exposed Through Intentional Conditioning
Gupta, Lokesh. SSRN, 2025. DOI: 10.2139/ssrn.5232429
A 90-day investigation into how large language models can be conditioned to bypass safeguards through polite, persistent inquiry rather than adversarial prompting. Conducted under responsible-disclosure principles; no real systems were accessed or manipulated.
Read on SSRN → DOI Full citation and BibTeX ↓Models, Maths and Public Validation Records
The mathematics behind pricing, probability bands and graph risk, explained in plain technical language, together with the public record that lets a model be checked. For students of quantitative finance, model builders, and anyone deciding how far to trust a published band.
Euler's Equation and Why Financial Markets Love It
Educational note | AION Research Notes | May 29, 2026
Explains Euler's equation as a bridge between growth, decay, cycles, probability, and market infrastructure rather than as a memorized formula.
- Frames discounting, compounding, and complex rotations as infrastructure ideas.
- Connects Fourier transforms to cycle/noise decomposition for algorithmic feature engineering.
Systemic Risk Model: Graph Theory and Market Crash Prediction
Educational note | AION Research Notes
Uses graph structure to explain how connectivity, leverage, correlation clusters, and liquidity stress turn local shocks into systemic risk.
- Treats institutions, funds, exchanges, derivatives, and capital flows as connected nodes.
- Shows why diversification can fail when correlations compress during stress.
AION Veritas Daily Probability Band Series: Bachelier to BSM
Probability band series | AION Research Notes | Daily public record
Publishes daily pre-market opening probability bands using the mathematical-finance lineage from Louis Bachelier's diffusion logic through Black-Scholes-Merton style option-implied probability thinking.
- Makes clear this is not invented math; it operationalizes Bachelier/BSM probability logic for Indian opening-range infrastructure.
- Builds public model accountability by separating band containment, directional conviction, and same-day verification.
Topics and keywords
Every series and the terms its notes and papers cover, taken from the notes themselves. Use it to find a topic, or to cite the right note.
Option Chains and Dealer Hedging: How Indian Index Prices Are Made
Tested Market Claims: Popular Beliefs Checked Against NIFTY Data
Trader Behaviour and Process: Why a Correct View Can Still Lose Money
Macro and Geoeconomics: How Outside Events Reach Indian Markets
Intelligence Infrastructure: AION Indian Market Intelligence
Market Rules and Investor Records: What Regulation Covers and Where It Stops
Cybersecurity and AI Safety: Gaps in Detection and Safeguards
Models, Maths and Public Validation Records
SSRN papers: full citations and BibTeX
Every DOI-registered paper, with its citation. Each paper is also listed under its theme above.
Asymmetric Multipolarity: Financial, Industrial, Resource, and Strategic Power in the Post-Unipolar Global Order
Gupta, Lokesh. SSRN, 2026. DOI: 10.2139/ssrn.6449739
A geoeconomic framework for reading the post-unipolar order through financial depth, industrial capacity, resource security and strategic autonomy.
Lokesh Gupta · AION Analytics (India) · ORCID 0009-0000-7501-9230
Gupta, L. (2026). Asymmetric Multipolarity: Financial, Industrial, Resource, and Strategic Power in the Post-Unipolar Global Order. SSRN. https://doi.org/10.2139/ssrn.6449739
BibTeX
@article{gupta2026asymmetricMultipolarity,
    author  = {Gupta, Lokesh},
    title   = {Asymmetric Multipolarity: Financial, Industrial, Resource, and Strategic Power in the Post-Unipolar Global Order},
    year    = {2026},
    journal = {SSRN Electronic Journal},
    doi     = {10.2139/ssrn.6449739},
    url     = {https://ssrn.com/abstract=6449739}
  }
Contextual Intelligence: A Causal Layer for Country-Specific Decisions
Gupta, Lokesh. SSRN, 2026. DOI: 10.2139/ssrn.7596079
General models supply language and reasoning but not the structure of a particular country. This paper describes a contextual layer, the bridge, that turns one economic event into a signed 32-sector incidence object: who gains, who loses, through which channel and after what delay. India is the first implementation; the architecture is country-agnostic. The system described is AION Indian Market Intelligence.
Lokesh Gupta · AION Analytics (India) · ORCID 0009-0000-7501-9230
Gupta, L. (2026). Contextual Intelligence: A Causal Layer for Country-Specific Decisions. SSRN. https://doi.org/10.2139/ssrn.7596079
BibTeX
@article{gupta2026contextualIntelligence,
    author  = {Gupta, Lokesh},
    title   = {Contextual Intelligence: A Causal Layer for Country-Specific Decisions},
    year    = {2026},
    journal = {SSRN Electronic Journal},
    doi     = {10.2139/ssrn.7596079},
    url     = {https://ssrn.com/abstract=7596079}
  }
Signal Provenance in Retail Algorithmic Trading: An Architectural Gap in SEBI's 2026 Framework and Its General Form
Gupta, Lokesh. SSRN, 2026. DOI: 10.2139/ssrn.7118421
SEBI's algorithmic trading framework closes the order chain but not the signal chain: a compliant order reaches the broker while what caused it remains invisible. The paper evidences that gap across India, the EU and the UAE and shows why origin capture is feasible.
Provisional patent filed 14 July 2026 - Application No. IN202621086466.
Lokesh Gupta · AION Analytics (India) · ORCID 0009-0000-7501-9230
Gupta, L. (2026). Signal Provenance in Retail Algorithmic Trading: An Architectural Gap in SEBI's 2026 Framework and Its General Form. SSRN. https://doi.org/10.2139/ssrn.7118421
BibTeX
@article{gupta2026signalProvenance,
    author  = {Gupta, Lokesh},
    title   = {Signal Provenance in Retail Algorithmic Trading: An Architectural Gap in SEBI's 2026 Framework and Its General Form},
    year    = {2026},
    journal = {SSRN Electronic Journal},
    doi     = {10.2139/ssrn.7118421},
    url     = {https://ssrn.com/abstract=7118421}
  }
Signal Provenance, Part 2. The Structural Harvest: Why SEBI's Retail Protection Measures Do Not Reach the Losses in Indian Index Derivatives
Gupta, Lokesh. SSRN, 2026. DOI: 10.2139/ssrn.7663940
SEBI's studies report about Rs 3.85 lakh crore of individual traders' net losses in Indian equity derivatives between FY22 and FY26. This paper examines what the regulatory record and public exchange data can establish about costs, counterparties, positioning, trading hours and signal provenance, and proposes information at the point of trade, including a provenance category carried with each order, tested in a pilot before any mandate.
Part 2 of the Signal Provenance series; Part 1 is SSRN 7118421.
Lokesh Gupta · AION Analytics (India) · ORCID 0009-0000-7501-9230
Gupta, L. (2026). Signal Provenance, Part 2. The Structural Harvest: Why SEBI's Retail Protection Measures Do Not Reach the Losses in Indian Index Derivatives. SSRN. https://doi.org/10.2139/ssrn.7663940
BibTeX
@article{gupta2026structuralHarvest,
    author  = {Gupta, Lokesh},
    title   = {Signal Provenance, Part 2. The Structural Harvest: Why SEBI's Retail Protection Measures Do Not Reach the Losses in Indian Index Derivatives},
    year    = {2026},
    journal = {SSRN Electronic Journal},
    doi     = {10.2139/ssrn.7663940},
    url     = {https://ssrn.com/abstract=7663940}
  }
The Great Indian Illusion: Unpacking the Gap Between Growth Statistics and Citizen Well-Being
Gupta, Lokesh. SSRN, 2026. DOI: 10.2139/ssrn.6973958
Headline indicators of the Indian economy can be accurate and incomplete at the same time. This paper examines the gap between growth aggregates and citizen well-being using primary data available as of June 2026.
Lokesh Gupta · AION Analytics (India) · ORCID 0009-0000-7501-9230
Gupta, L. (2026). The Great Indian Illusion: Unpacking the Gap Between Growth Statistics and Citizen Well-Being. SSRN. https://doi.org/10.2139/ssrn.6973958
BibTeX
@article{gupta2026greatIndianIllusion,
    author  = {Gupta, Lokesh},
    title   = {The Great Indian Illusion: Unpacking the Gap Between Growth Statistics and Citizen Well-Being},
    year    = {2026},
    journal = {SSRN Electronic Journal},
    doi     = {10.2139/ssrn.6973958},
    url     = {https://ssrn.com/abstract=6973958}
  }
The Signature Trap: Structural Gaps in Spyware Detection and the Limits of Indicator-Based Defense
Gupta, Lokesh. SSRN, 2026. DOI: 10.2139/ssrn.7503278
Signature-based spyware detection reports nothing during the exact window between an attack's first use and its first published indicator, so the absence of a match can never mean safety. This paper examines fourteen attack vectors and names the trust assumption that fails in each case.
Companion to Signal Provenance in Retail Algorithmic Trading (SSRN 7118421); same reconstruct-versus-observe diagnostic.
Lokesh Gupta · AION Analytics (India) · ORCID 0009-0000-7501-9230
Gupta, L. (2026). The Signature Trap: Structural Gaps in Spyware Detection and the Limits of Indicator-Based Defense. SSRN. https://doi.org/10.2139/ssrn.7503278
BibTeX
@article{gupta2026signatureTrap,
    author  = {Gupta, Lokesh},
    title   = {The Signature Trap: Structural Gaps in Spyware Detection and the Limits of Indicator-Based Defense},
    year    = {2026},
    journal = {SSRN Electronic Journal},
    doi     = {10.2139/ssrn.7503278},
    url     = {https://ssrn.com/abstract=7503278}
  }
The Uncodified Margin: Human Relational Intelligence as a Structural Complement to Algorithmic Systems in Five Emerging Markets
Gupta, Lokesh. SSRN, 2026. DOI: 10.2139/ssrn.7235801
Algorithmic systems can act only on information that has been codified. This paper names the decision-relevant information that remains outside formal records as the uncodified margin and examines why it persists in emerging-market commerce.
Supersedes Bridging the Gap (SSRN 5140987).
Lokesh Gupta · AION Analytics (India) · ORCID 0009-0000-7501-9230
Gupta, L. (2026). The Uncodified Margin: Human Relational Intelligence as a Structural Complement to Algorithmic Systems in Five Emerging Markets. SSRN. https://doi.org/10.2139/ssrn.7235801
BibTeX
@article{gupta2026uncodifiedMargin,
    author  = {Gupta, Lokesh},
    title   = {The Uncodified Margin: Human Relational Intelligence as a Structural Complement to Algorithmic Systems in Five Emerging Markets},
    year    = {2026},
    journal = {SSRN Electronic Journal},
    doi     = {10.2139/ssrn.7235801},
    url     = {https://ssrn.com/abstract=7235801}
  }
Beyond the Mirror: Systemic Vulnerabilities in LLM Safeguards Exposed Through Intentional Conditioning
Gupta, Lokesh. SSRN, 2025. DOI: 10.2139/ssrn.5232429
A 90-day investigation into how large language models can be conditioned to bypass safeguards through polite, persistent inquiry rather than adversarial prompting. Conducted under responsible-disclosure principles; no real systems were accessed or manipulated.
Lokesh Gupta · AION Analytics (India) · ORCID 0009-0000-7501-9230
Gupta, L. (2025). Beyond the Mirror: Systemic Vulnerabilities in LLM Safeguards Exposed Through Intentional Conditioning. SSRN. https://doi.org/10.2139/ssrn.5232429
BibTeX
@article{gupta2025beyondTheMirror,
    author  = {Gupta, Lokesh},
    title   = {Beyond the Mirror: Systemic Vulnerabilities in LLM Safeguards Exposed Through Intentional Conditioning},
    year    = {2025},
    journal = {SSRN Electronic Journal},
    doi     = {10.2139/ssrn.5232429},
    url     = {https://ssrn.com/abstract=5232429}
  }
AION research index
Chronological index of published research notes and explainers. Daily probability-band records are at /veritas/validation.
- Oct 22, 2026 - What the Consolidated Account Statement Shows, and What It Cannot
- Oct 22, 2026 - One Scoreboard, Two Books: How a Combined P&L Distorts Decisions
- Oct 22, 2026 - Are One-Minute NIFTY Candles Mostly Noise? A Variance Ratio Test
- Oct 22, 2026 - Quarter-End Window Dressing: Testing the Claim on NIFTY
- Oct 22, 2026 - The Day After Expiry: Testing the Morning Rally and Fade on NIFTY
- Oct 8, 2026 - The OI-to-Price Divergence: When Open Interest and Spot Disagree
- Oct 8, 2026 - When F&O Is Not for You
- Oct 8, 2026 - The Closing Auction: How the Close Is Set Since August 2026
- Oct 8, 2026 - The Gamma Flip: When Dealers Stop Damping and Start Amplifying
- Oct 8, 2026 - The Pre-Open Auction: Why 9:00 to 9:15 AM Prices Lie
- Oct 8, 2026 - The Multi-Asset Cross-Hedge: Why Crude Moves Nifty
- Oct 8, 2026 - Expiry Week Mechanics: Why Tuesday Is Not Like Friday
- Oct 8, 2026 - Open Interest Is Not a Forecast: It Is a Map of Trapped Positions
- Oct 8, 2026 - The VIX Crush: Why Your Option Loses Value Even When You Are Right
- Oct 8, 2026 - Gamma Squeeze Mechanics: Why Dealers Accelerate Their Own Pain
- Oct 8, 2026 - Why Max Pain Matters (And When It Doesn't)
- Jun 22, 2026 - The FII-DII Headline Is Lagging: What Actually Moved the Market on April 8
- Jun 10, 2026 - How OpenAlgo's symtoken Handles 31 Brokers and Why Multi-Broker Execution Is Still Hard
- Jun 1, 2026 - Options Greeks: Why Did My Option Move More (or Less) Than Expected?
- May 29, 2026 - Euler's Equation, the beauty of 5 constants and why financial markets love it
- May 26, 2026 - Bull Traps, Bear Traps, and Emotional Confirmation Bias
- May 26, 2026 - The Bear Trap: How Capitulation Sellers Get Harvested
- May 21, 2026 - Retail investors often focus on headlines after panic begins, but is that enough?
- May 18, 2026 - SEBI Governance Blind Spot on Static IP
- May 17, 2026 - A macro-event sector impact API for Indian market intelligence
- May 17, 2026 - The Great Indian Illusion: Part 2: Gold as economic hedge
- May 10, 2026 - When should you enter a market? The 15-minute opening-window rule
- Apr 9, 2026 - The Great Indian Illusion: five structural cracks in the headline narrative
- Apr 8, 2026 - Gold-silver ratio as a risk regime signal
- Mar 18, 2026 - The High VIX Trap: why market fear is often a siren song for retail traders
- Mar 5, 2026 - Who lost in the crash: anatomy of losses in the 2025 correction
- Feb 12, 2026 - Your Trading Car: a minimalist dashboard for intraday and equity decisions
- Jan 2026 - Dollar-metals dynamic and why macro called the gold move 40 days early
- Community note - Systemic Risk Model: graph theory and market crash prediction
New papers can be added as formal SSRN publications, model validation reports, regulatory notes, or educational explainers. Research pipeline is part of the infrastructure.
Send research link →