Open Interest Is Not a Forecast: It Is a Map of Trapped Positions
Open interest shows where option positions are concentrated. It does not show where the market is going. The useful question is who is trapped, and at what price.
Most retail traders look at open interest and think it tells them where the market is going. It does not. Open interest, or OI, tells you where positions are concentrated. That is a map. A map is not a forecast.
The useful question to ask of the map is this: who is trapped, and at what price?
What open interest counts
Open interest is the number of contracts at a strike that are still open. Every one of those contracts has a buyer and a writer. The number goes up when a new buyer meets a new writer, and it goes down when both sides close.
The exchange publishes the count. It does not publish who is on which side. The reading below uses the common assumption that retail traders are mostly the buyers and that the desks, meaning the proprietary and institutional books, are mostly the writers. That assumption is often reasonable for options far from spot. It is not always true.
Reading the two sides
Call OI building at a strike above spot. On the usual reading, retail traders are buying Calls there and the desks are selling them. If spot rises toward that strike, the desks have to hedge by buying futures. For the price, that is a mechanical tailwind.
Put OI building at a strike below spot. On the same reading, retail traders are buying Puts and the desks are selling them. If spot falls toward that strike, the desks have to hedge by selling futures. For the price, that is a mechanical headwind.
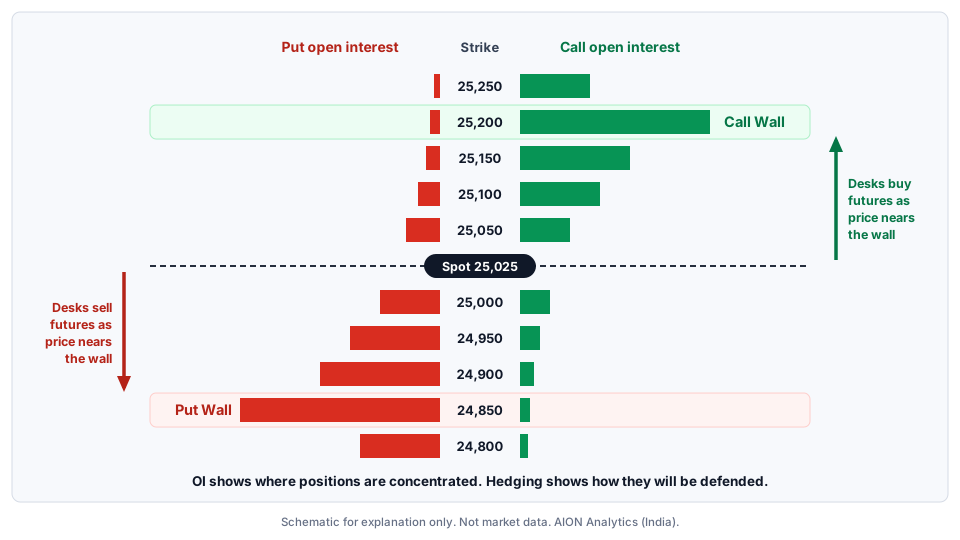
Figure 1. Open interest by strike, with the Call Wall, the Put Wall and the hedging flows on the way to each. Strikes run from top to bottom, so spot is drawn as a horizontal line. Schematic, not market data.
The trap
When OI builds at a strike and spot never reaches it, the buyers there lose the premium they paid. The writers keep it. Most of the time, this is how the position ends.
This is also why large OI clusters often behave like magnets. The market does not want to go anywhere. The pull comes from hedging. As spot moves toward the strike where the desks' exposure is largest, the hedging they must do pushes price further in the same direction.
A wall is two things
The word wall suggests a barrier, and the word magnet suggests the opposite. Both descriptions are in use because two different things happen at a large strike.
- On the way there, hedging of the options already written pulls price toward the strike. This is the magnet.
- At the strike, the writers have the most to lose, so they defend it. They write more options there and adjust with futures. This is the wall.
If the defence holds, price stalls near the strike into expiry. If it fails, the same hedging that was pulling price toward the wall now pushes it through, and the move accelerates. That second case is described in the note on gamma squeeze mechanics.
What to look at
- The ratio of Call OI to Put OI at each strike. A single total for the whole chain hides where the imbalance sits.
- The rate of change in OI. The percentage increase matters more than the absolute number. A strike that has doubled since yesterday says more than a strike that has been large all month.
- The distance between the highest OI strike and spot. If spot is far from the wall, the wall is weak, because the hedging need there is still small. If spot is close, the wall is strong.
What this note does not claim
Everything above depends on the assumption about who wrote the options. When the large writers at a strike are themselves hedged in other ways, or when the buyers are institutions and not retail traders, the hedging flows can be smaller than expected or run the other way.
Open interest is also a snapshot. It can be built in the morning and unwound by the afternoon. No strike level in this note is a prediction, and no hit rate is claimed for walls holding or breaking.