Are One-Minute NIFTY Candles Mostly Noise? A Variance Ratio Test
A common claim says one-minute candles on Indian indices are dominated by noise from fast traders, so their moves tend to reverse. In 66 complete sessions of NIFTY 50 spot data, one-minute moves did not reverse: their variance grows with the horizon about as a random walk's would.
The claim: a one-minute candle on an Indian index is not like a one-minute candle elsewhere. In quiet hours a single order of a few dozen lots from an algorithm can spike it, so indicators computed on one-minute candles give false breakouts, and the moves they show tend to reverse. One-minute charts are said to be mostly noise.
The claim mixes a point about what the index is with a point about how its moves behave. Both can be checked.
What an index candle is made of
NIFTY 50 is not traded. Its value is calculated by NSE Indices from the prices of its fifty constituent stocks, weighted by free-float market capitalisation, and recalculated through the session. An order in NIFTY futures or NIFTY options does not print in the index. It can reach the index only by moving the prices of the constituents, for example through arbitrage between futures and the stocks.
So a single order of a few dozen lots cannot by itself spike the spot index candle. On the chart of a thinly traded option contract, a single order can move the price a long way; that is a different instrument. Which chart is being read decides which claim is being tested. This note tests the spot index.
How noise shows up in data, and how to measure it
When a traded price bounces between the bid and the ask, successive price changes tend to reverse: an up-tick is more often followed by a down-tick (Roll, 1984). That is the signature of microstructure noise, and it is why researchers who work with high-frequency data choose their sampling interval with care (Ait-Sahalia, Mykland and Zhang, 2005).
A standard test is the variance ratio (Lo and MacKinlay, 1988). Take one-minute returns and k-minute returns over the same sessions. If prices follow a random walk, the variance of k-minute returns is k times the variance of one-minute returns, and the ratio VR(k) = Var(k-minute) / (k x Var(one-minute)) is 1. If one-minute moves tend to reverse, VR is below 1. If they tend to continue, VR is above 1.
An index has a known reason to sit above 1. Its constituents do not all trade in the same second, so some of the prices in each calculation are slightly old, and a move in the market reaches the index over several minutes. This makes index returns slightly positively correlated (Lo and MacKinlay, 1990).
Data and method
- NIFTY 50 one-minute closes for every complete session available, 66 sessions from December 29, 2025 to April 6, 2026.
- Returns from 09:16 onward. The 09:15 print is left out because it carries the overnight gap.
- VR(k) at 2, 5, 10, 15 and 30 minutes, with 95 percent intervals from resampling whole sessions, and the first-order autocorrelation of one-minute returns. 24,618 one-minute returns in all.
Results
| Horizon k | 2 min | 5 min | 10 min | 15 min | 30 min |
|---|---|---|---|---|---|
| VR(k) | 1.00 | 1.11 | 1.01 | 1.16 | 0.98 |
| 95% interval | 0.97 to 1.03 | 1.02 to 1.24 | 0.91 to 1.11 | 0.94 to 1.46 | 0.87 to 1.10 |
The first-order autocorrelation of one-minute returns is +0.02.
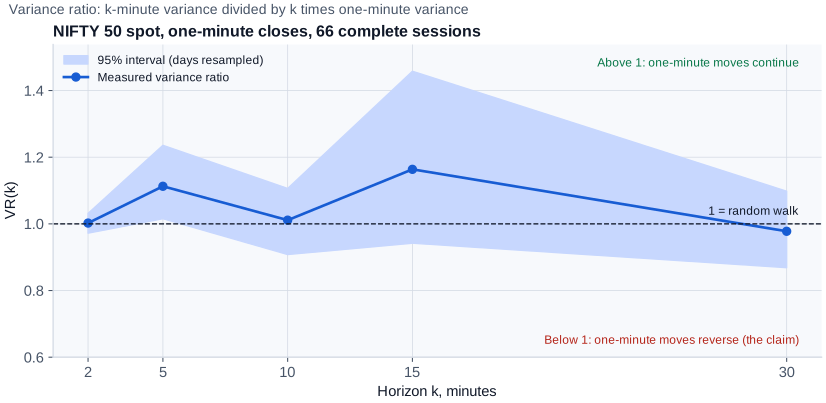
Figure 1. Variance ratio of NIFTY 50 spot one-minute returns, 66 complete sessions, December 2025 to April 2026. Shaded band: 95 percent interval, sessions resampled.
Reading the results
No horizon shows a ratio below 1 that the data can distinguish from chance. One-minute moves in the spot index do not tend to reverse. The ratio is close to 1, as for a random walk, and at five minutes it is slightly above 1, the direction expected from stale constituent prices. The autocorrelation of +0.02 says the same thing: a one-minute move carries almost no information about the next one, in either direction.
So the spot index's one-minute candles do not show the noise the claim describes. What they do show is very little: a one-minute move is close to unpredictable from the one before it, which is a different reason to be careful with indicators computed on them.
What this test does not cover
- Futures and options candles. Bid-ask bounce and single large orders matter most there, and this test does not use them.
- Whether any indicator gives false signals on one-minute charts. That depends on the indicator and its settings and needs its own test.
- Other periods. Sixty-six sessions in one season is a small sample; the quiet midday hours alone were not tested separately.
The data come from a broker's historical feed, not NSE's official files. Researchers who study order flow at short horizons use measures such as order flow imbalance (Cont, Kukanov and Stoikov, 2014), which needs order book data, not candles.
Reproducing it
The Zenodo record of this note holds the analysis script and the summary table. The script reads a plain file of one-minute closes for complete sessions.
Sources
- Roll, R. (1984). A Simple Implicit Measure of the Effective Bid-Ask Spread in an Efficient Market. Journal of Finance, 39(4), 1127-1139.
- Lo, A. and MacKinlay, A. C. (1988). Stock Market Prices Do Not Follow Random Walks: Evidence from a Simple Specification Test. Review of Financial Studies, 1(1), 41-66.
- Lo, A. and MacKinlay, A. C. (1990). An Econometric Analysis of Nonsynchronous Trading. Journal of Econometrics, 45(1-2), 181-211.
- Ait-Sahalia, Y., Mykland, P. and Zhang, L. (2005). How Often to Sample a Continuous-Time Process in the Presence of Market Microstructure Noise. Review of Financial Studies, 18(2), 351-416.
- Cont, R., Kukanov, A. and Stoikov, S. (2014). The Price Impact of Order Book Events. Journal of Financial Econometrics, 12(1), 47-88.
- NSE Indices, NIFTY 50 index methodology (free-float market capitalisation weighting).