The High VIX Trap: Why Market Fear Becomes a Siren Song
Correction, 28 October 2026. The first version of this note said that a VIX of 20 means the market expects moves "roughly 20 points wide per day, annualised". That was wrong. India VIX is an annualised volatility in percent over the next 30 calendar days, so a reading of 20 means about 20 percent a year, which is about 1.26 percent for one trading day (20 divided by the square root of 252), one standard deviation, in either direction. The sentence has been replaced. The sections that told readers how to size, write or time option positions have been rewritten as a description of the mechanism, because AION publishes information, not advice. Two statements that this note did not support with data (that the VIX "consistently overstates realised volatility during panic", and that "in almost every case" it peaks before the maximum pain in equities) have been narrowed to what the mechanism shows. The earlier text is kept in the site's change history.
A rising India VIX does not signal direction. It signals expected swing magnitude. This distinction determines whether a retail F&O trader is reading a warning or walking into a trap.
In recent weeks, the Indian stock market has turned distinctly choppy. The Nifty slipping below psychologically important levels changes the mood, and with it, the India VIX, our "fear gauge", starts to spike. For many retail investors, a rising VIX looks like an opportunity: more movement means more chances to profit, right?
That logic is the trap.
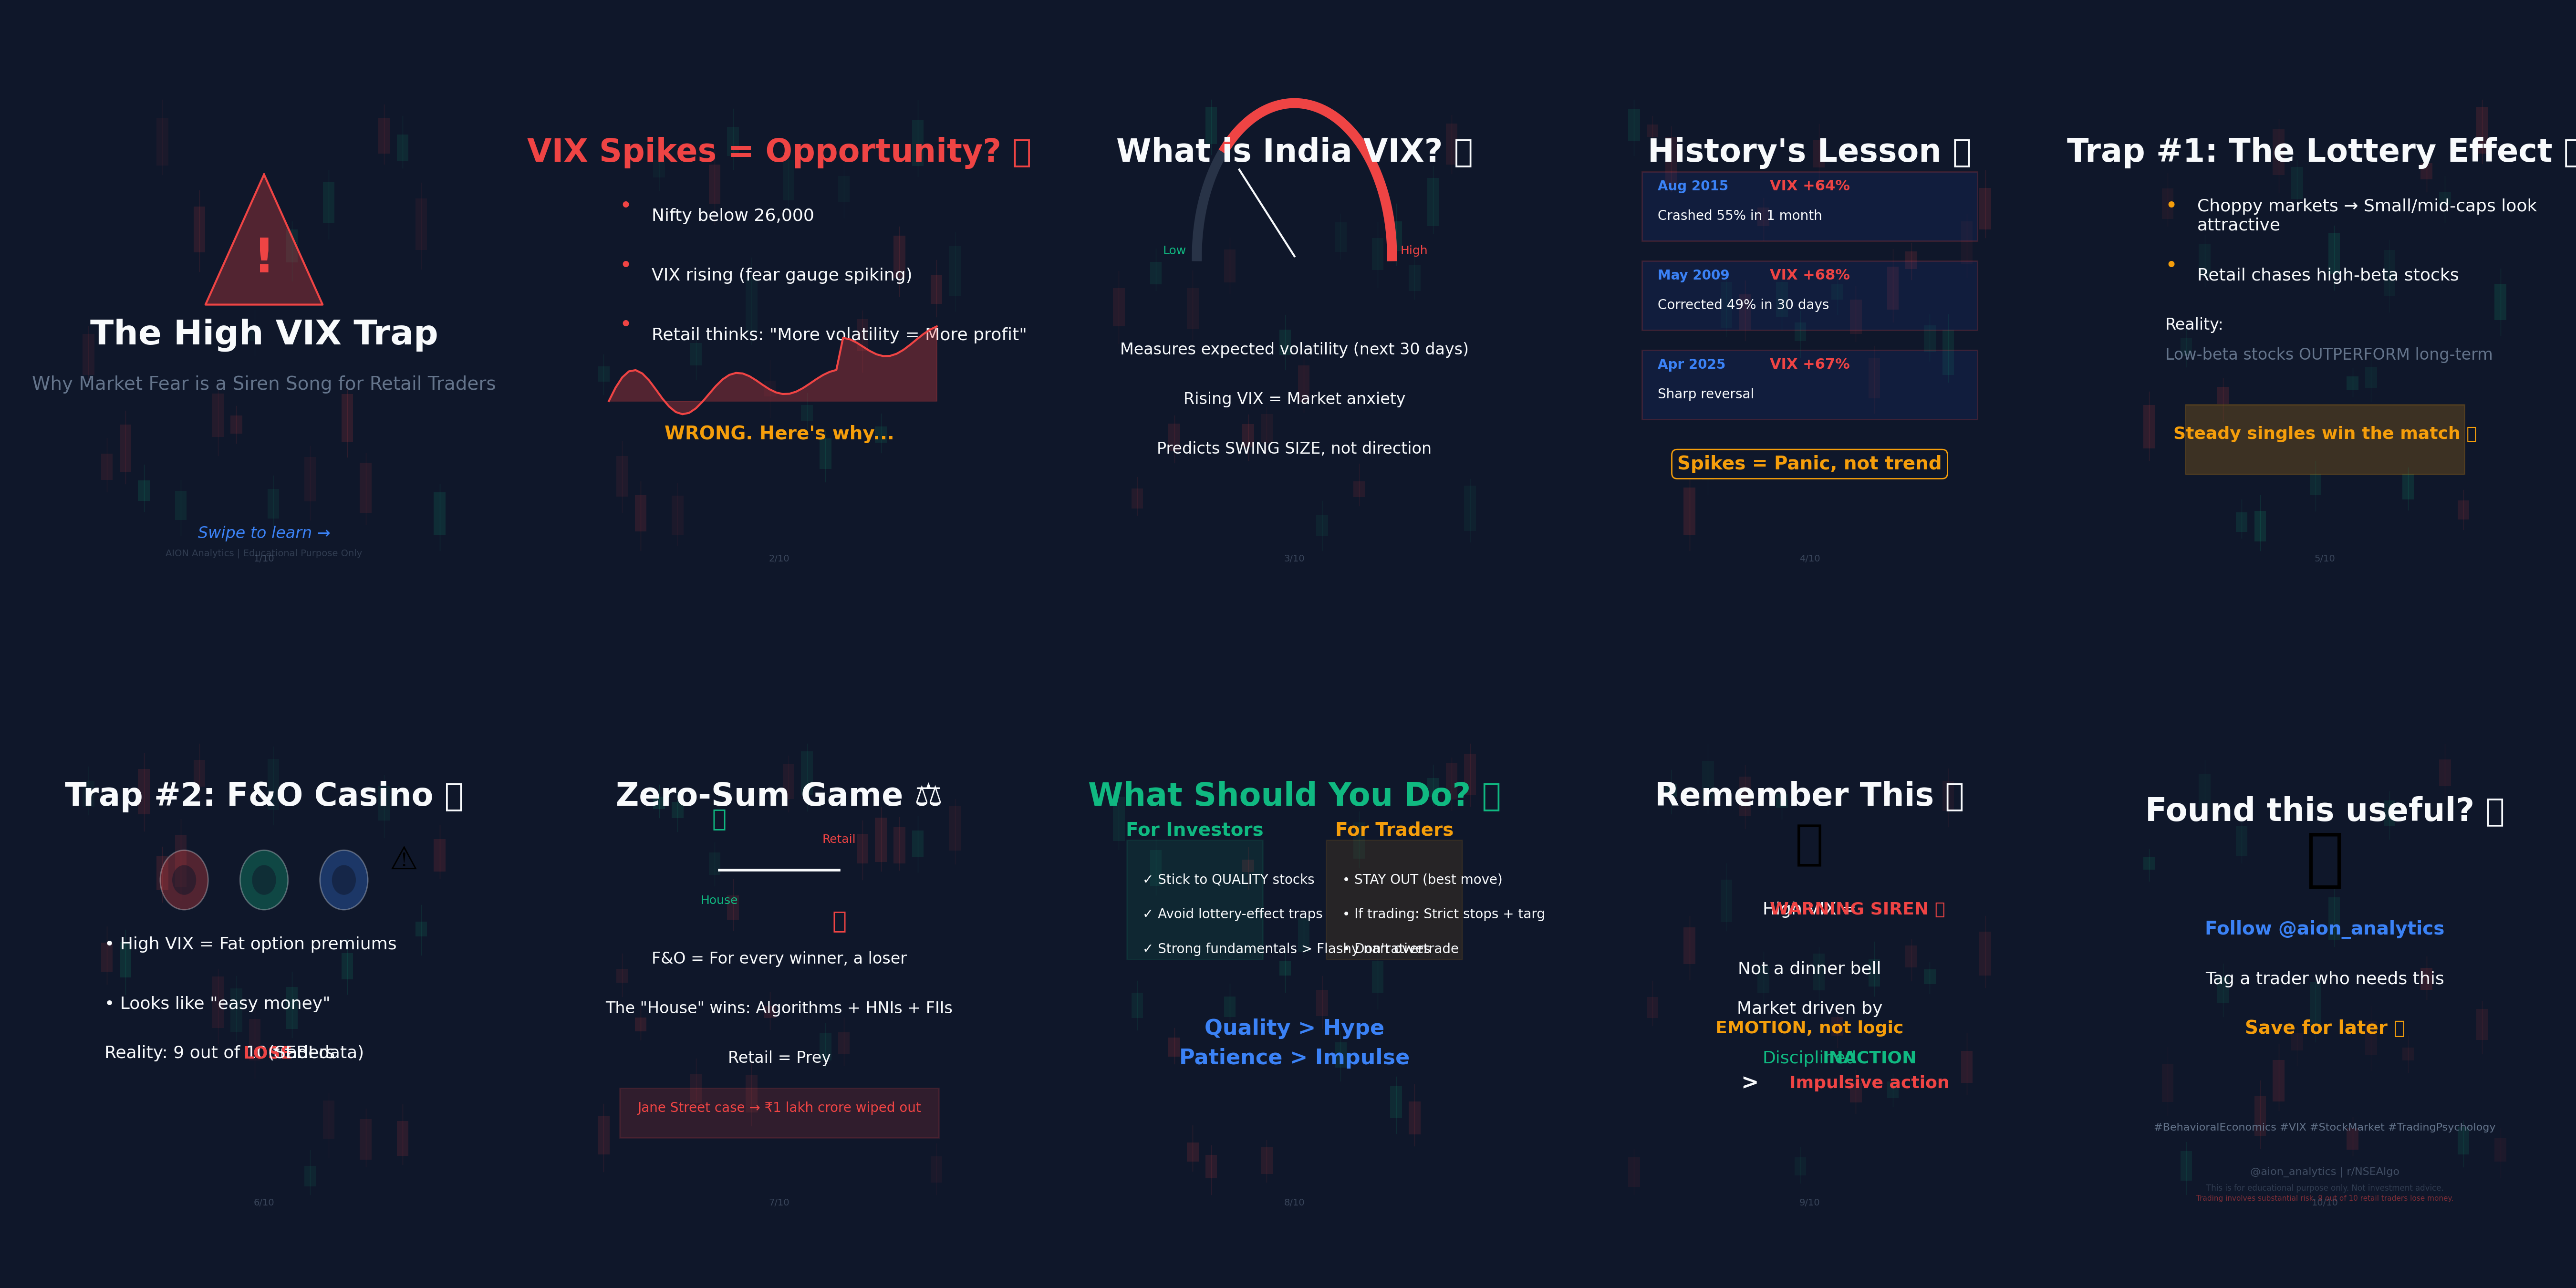
AION carousel explainer: VIX mechanics and why high volatility traps retail F&O participants.
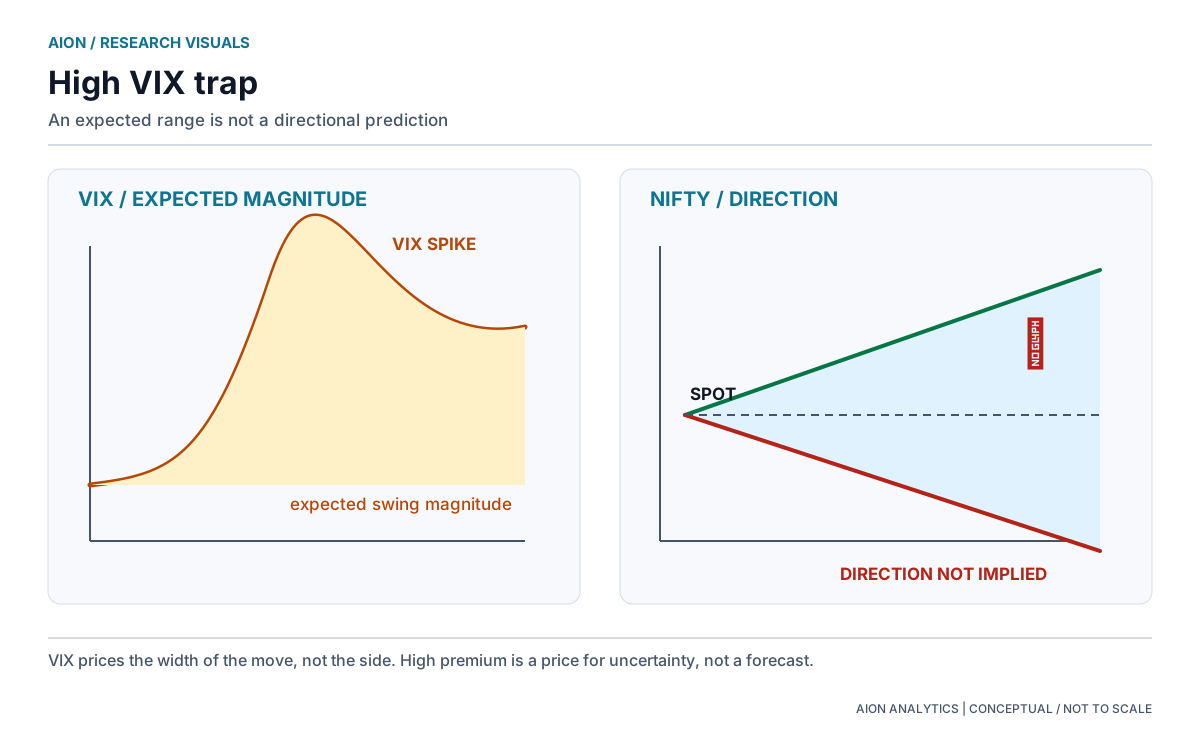
India VIX prices how wide the move may be, not which way it goes. Schematic, not to scale.
What the India VIX actually measures
The India VIX measures the market's expectation of volatility over the next 30 days. A rising VIX does not mean prices will go up or down. It means the market is pricing in larger swings in either direction. The VIX is a magnitude signal, not a directional one.
This is the first misread. A VIX at 20 does not tell you which way the market will move. It tells you that NIFTY option prices imply volatility of about 20 percent a year over the next 30 calendar days (NSE, India VIX). Spread over one trading day, that is 20 divided by the square root of 252, about 1.26 percent: one standard deviation, up or down. Retail participants who treat a spike as a directional buy signal are responding to the wrong instrument entirely.
Why high VIX inflates option premiums
Options are priced using implied volatility as a core input. When VIX rises, option premiums expand: both calls and puts become more expensive. This is structurally important because the premium expansion benefits option writers (who collect more), not option buyers (who pay more for the same exposure).
In a high VIX environment, the retail buyer pays an inflated premium for directional bets. If the market then moves less than the VIX implied, the option can expire worthless or at a loss even if the direction was correct. Implied volatility is a price, not a forecast that is checked and refunded: when the realised move falls short of it, the buyer has paid for movement that did not come. The premium paid was the trap.
Historical pattern: panic overshoot
In Indian markets, VIX spikes are frequently associated with systemic panic events: budget days, US Fed announcements, geopolitical shocks, or election results. This note has not measured how often the VIX peaks before equities reach their low in those episodes. What the mechanism shows is narrower: once the event that drove the spike has passed, the uncertainty it carried is gone, and implied volatility can fall even if the index has not recovered.
An option bought after the VIX has spiked carries the panic in its price: the buyer enters after the higher implied volatility has been priced in. If implied volatility then falls, the premium loses value from that fall alone, even if the index stabilises.
What a high VIX changes for each side of an option
A VIX spike changes the terms on which every option trades. The changes can be described without saying what anyone should do about them:
- The range of outcomes widens: a higher implied volatility means a wider spread of index levels is priced as plausible over the life of the option. The same number of lots carries a larger range of possible profit and loss than it did at a lower VIX.
- The buyer and the writer face different gaps: the buyer of an option gains only if the realised move is larger than the move the premium already paid for. The writer of an option comes out ahead only if the realised move is smaller. When implied volatility is high, the premium is larger for both, and so is the move the buyer needs. A writer of an uncovered option can lose more than the premium received, so a larger premium also comes with a larger exposure if the move exceeds what was priced.
- Implied volatility can fall on its own: once the event behind a spike has passed, implied volatility can drop even if the index does not move. That fall lowers the price of options already held, calls and puts alike.
- Not every spike has the same cause: a systemic shock (a credit event, a regulatory failure) and a sentiment shock can produce similar VIX readings. The reading alone does not say which one is under way.
The F&O zero-sum framing
India's F&O market is among the largest retail-dominated derivative markets in the world by trade count. The structural reality of options is zero-sum: premium paid by buyers is premium received by writers. When VIX is high and retail buyers are paying elevated premiums, the other side of those trades is being taken by participants with better risk discipline and longer timeframes.
The SEBI data is unambiguous: the overwhelming majority of individual F&O participants lose money over multi-year periods. The VIX trap is one mechanism through which that transfer occurs. It is not random noise: it is a structural feature of how retail panic interacts with derivative pricing.
What the VIX says and does not say
India VIX says how large the market prices the coming moves to be. At 20, that is about 1.26 percent for one trading day, one standard deviation, up or down. At 25, the same arithmetic gives 25 divided by the square root of 252, about 1.57 percent. It does not say which way the index will move, whether the realised move will be larger or smaller than the priced one, or when the reading will fall. Those are the gaps through which a high VIX turns into a loss for a buyer who read it as a direction.