Quarter-End Window Dressing: Testing the Claim on NIFTY
A common claim says domestic institutions lift the index on the last day of a quarter to flatter reported values, and the index falls back the next day. On the 23 quarter-ends from December 2020 to June 2026, NIFTY closed lower more often than higher on the quarter-end day, and the next day was more often up than down.
The claim runs like this. On the last trading day of a quarter, domestic institutions, mainly mutual funds and insurers, buy large index stocks to lift the closing print, because the quarter-end values are the ones their investors will see. A morning fall is bought back by the close. The next day the buying stops and the index falls again. A trader who reads the quarter-end rally as a change of trend is caught.
This note sets out what the research literature finds about window dressing and then tests the claim on NIFTY 50.
Is there a rule that requires it?
The claim is sometimes put as a mandate: funds are said to be required to show a healthy NAV at quarter-end. We found no such rule. A fund's NAV is computed from the market prices of what it holds; it is a calculation, not a target. What exists is an incentive. Period-end holdings and values appear in reports and fact sheets, and a manager may prefer them to look good. Whether that incentive moves prices is an empirical question.
What the literature finds
- Window dressing of holdings. Lakonishok, Shleifer, Thaler and Vishny (1991) found that pension fund managers in the United States sold losing stocks before the year-end report, so that the reported portfolio looked better. That is about what is shown, not about moving prices.
- Leaning for the tape. Carhart, Kaniel, Musto and Reed (2002) found that stocks held by US equity mutual funds rose more than other stocks at quarter-ends, much of it in the last minutes of trading, and partly reversed on the next day. The effect was strongest at year-end and in smaller stocks held by funds with the most to gain.
- Hedge funds. Ben-David, Franzoni, Landier and Moussawi (2013) reported a similar quarter-end rise and next-day reversal in stocks held by hedge funds.
- Turn of the month. Separately, Ariel (1987) and Lakonishok and Smidt (1988) found that US stock returns are concentrated around the turn of each month, in the last trading day and the first few of the next.
Two points matter for the claim. The documented price effect is in individual stocks, mostly smaller ones, not in a broad index of large companies. And the documented pattern is a rise at the close followed by a partial reversal, which is what the claim says. So the claim is a reasonable hypothesis to carry over to India. It still has to be tested here.
Data and method
- NIFTY 50 daily open and close, December 15, 2020 to September 10, 2026: 1,418 weekday sessions. Special weekend sessions are left out.
- Event days: the last trading day of each month (69) and of each quarter, March, June, September and December (23).
- Measures: the day's move (close against previous close), the move from open to close, and the next day's move. The claim predicts a positive first or second and a negative third.
- Tests as in the companion notes: means, medians, Welch and Mann-Whitney tests, bootstrap 95 percent intervals.
Results
| Quarter-end (23) | Month-end (69) | Other days | |
|---|---|---|---|
| Day's move, mean (median) | 0.00% (-0.14%) | -0.06% (-0.14%) | +0.04% to +0.05% |
| Days closing up | 7 of 23 (30%) | 39% | 54% |
| Open to close, mean (median) | -0.05% (-0.31%) | -0.07% (-0.13%) | -0.04% |
| Next day's move, mean | +0.27% (p = 0.17) | +0.33% (p = 0.016) | +0.03% to +0.04% |
| Next day up | 16 of 23 (70%) | 61% | 53% |
| Up on the day, then down the next | 2 of 23 (8.7%) | 14.5% | about 23% |
"Other days" means every day that is not the event in that column, so the range covers both comparisons.
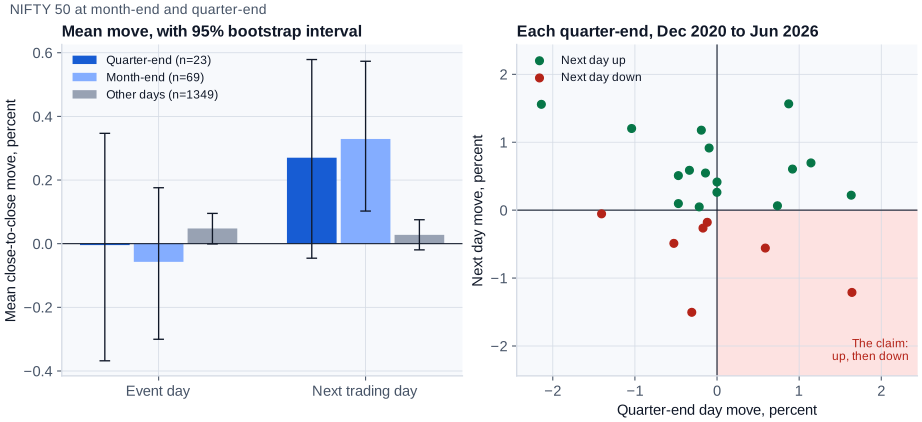
Figure 1. NIFTY 50 around month-ends and quarter-ends. Left: means with 95 percent bootstrap intervals. Right: one point per quarter-end. Market data, December 2020 to September 2026.
Reading the results
The quarter-end rally is not in the index. NIFTY closed higher on 7 of 23 quarter-ends. The average move from open to close was slightly negative. Nothing in the quarter-end day itself is distinguishable from an ordinary day.
The next-day fall is not there either. The day after a quarter-end was up on 16 of 23 occasions. The sequence the claim describes, up on the quarter-end and down the next day, happened twice in 23 quarters, less often than on ordinary days.
One date in particular. The claim is sometimes illustrated with June 30, 2026. On that day NIFTY fell 0.34 percent from the previous close and 0.69 percent from its open to its close; the next day it rose 0.59 percent. Neither half of the claim describes that date.
What does show up is a turn-of-the-month rise. The day after a month-end averaged +0.33 percent, against about +0.03 percent on other days, and the bootstrap interval for the difference, +0.08 to +0.55 percentage points, excludes zero. That resembles the turn-of-the-month effect in the literature. The literature offers several explanations, including the timing of cash flows into funds at the start of a month; this note does not test any of them.
Conclusion
In NIFTY 50 from December 2020 to June 2026, there is no quarter-end rise and no next-day fall of the kind the claim describes. That does not rule out window dressing in individual stocks, especially smaller ones held by funds, which is where the literature finds it; this test cannot see that. It rules out the index-level version of the claim over this period.
Limits of this test
- Twenty-three quarter-ends is a small sample. A real effect of a tenth of a percent would not be detectable.
- It uses the index only. Stock-level tests would need fund holdings data, which this note does not use.
- The index data come from a broker's historical feed, not NSE's official files. The tests are not corrected for multiple comparisons.
Reproducing it
The Zenodo record of this note holds the analysis script, the summary table and the list of month-end and quarter-end dates. The script reads a plain file of daily opens and closes, so it can be rerun on NSE's own historical index data.
Sources
- Lakonishok, J., Shleifer, A., Thaler, R. and Vishny, R. (1991). Window Dressing by Pension Fund Managers. American Economic Review, Papers and Proceedings, 81(2), 227-231.
- Carhart, M., Kaniel, R., Musto, D. and Reed, A. (2002). Leaning for the Tape: Evidence of Gaming Behavior in Equity Mutual Funds. Journal of Finance, 57(2), 661-693.
- Ben-David, I., Franzoni, F., Landier, A. and Moussawi, R. (2013). Do Hedge Funds Manipulate Stock Prices? Journal of Finance, 68(6), 2383-2434.
- Ariel, R. (1987). A Monthly Effect in Stock Returns. Journal of Financial Economics, 18(1), 161-174.
- Lakonishok, J. and Smidt, S. (1988). Are Seasonal Anomalies Real? A Ninety-Year Perspective. Review of Financial Studies, 1(4), 403-425.