 AION
Research / Retail Investor Field Guide
Retail investor field guide | Lesson 1 of 11 | Option Chains and Dealer Hedging
How to Read an Option Chain Without Treating It as a Forecast
Read strikes, Call and Put open interest, OI changes and Max Pain from a real historical NIFTY screen. Learn what each field cannot tell you.
What is on the screen?
Each row is a strike price. Calls are on the left and Puts are on the right. The number shown under OI is open interest, which counts contracts still outstanding, not the number traded today. Kite displays OI in total underlying quantity, while exchange OI can appear in lots. The same exposure will therefore show different numbers until the units are converted.
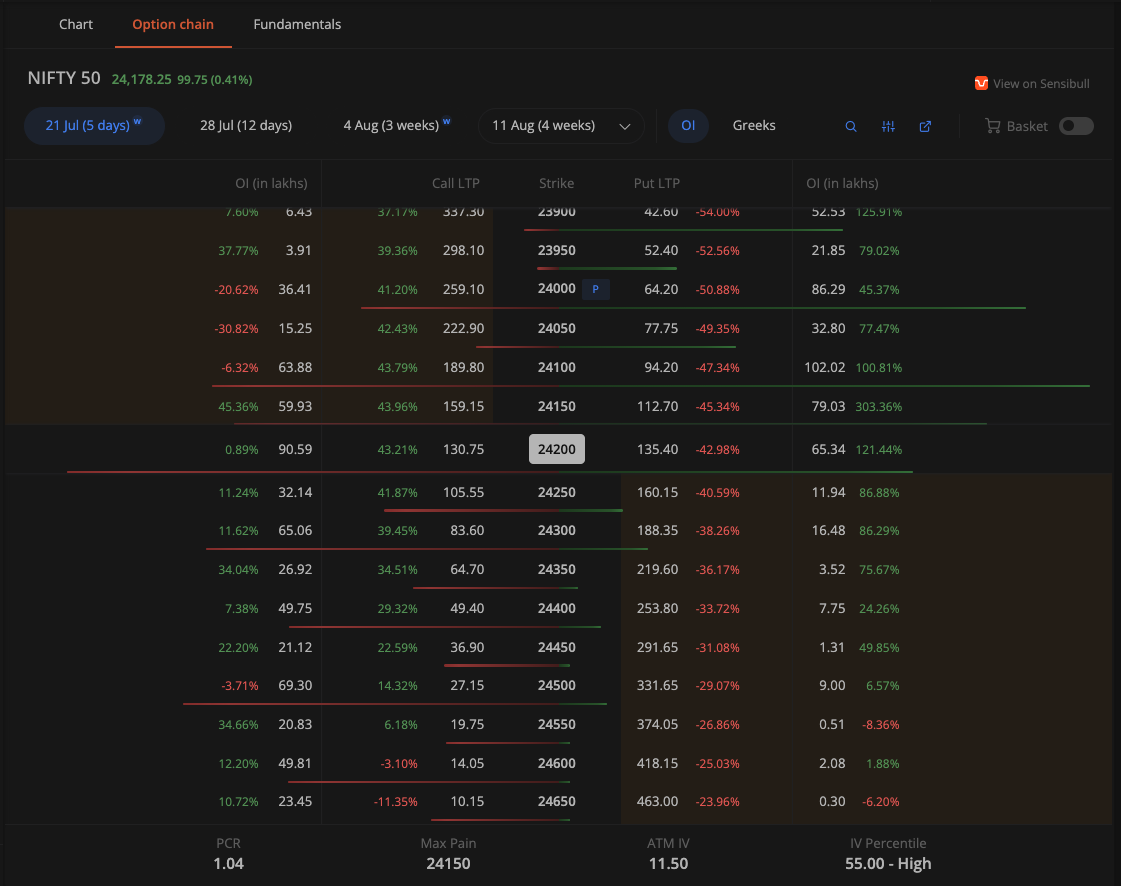
Read the numbers without inventing motives
In this visible portion of the July 16 screen, Call OI at the 24,200 strike is 90.59 lakh units and Put OI at 24,100 is 102.02 lakh units. These are examples of where reported positioning was concentrated among the strikes shown. Neither number identifies an institution, proves that the market will stop at the strike, or gives a reliable probability of a breakout.
People often call large Call OI a possible Call wall and large Put OI a possible Put wall. Treat these as descriptive labels. A market maker may be hedging, a participant may own another leg of a spread, and a fund may hold cash and options together. The public chain cannot reconstruct those books.
Three-day observation exercise
- Day 1. Record the expiry, time, spot level, two largest visible Call and Put OI readings, and OI change. Take snapshots at 9:45 AM and 3:15 PM.
- Day 2. Repeat with the same expiry and strike range. Note which concentrations moved or disappeared.
- Day 3. Repeat and compare the underlying's actual range with the levels identified beforehand. Log both cases that respected the levels and cases that crossed them.
What this evidence does not prove
OI is a snapshot, not a statement of intent. It does not identify buyers versus writers, net dealer gamma, or whether desks will defend a level. This single historical screenshot is an illustration, not a backtest or a measured hit rate.
Further reading: Open Interest Is Not a Forecast: It Is a Map of Trapped Positions and The OI-to-Price Divergence. Broker reference: Zerodha on the Kite option chain and OI units.
Related research: Open Interest Is Not a Forecast.