 AION
Research / Retail Investor Field Guide
Lesson 2 of 11 | Intraday Market Structure
VWAP: A Session Benchmark, Not Institutional Cost
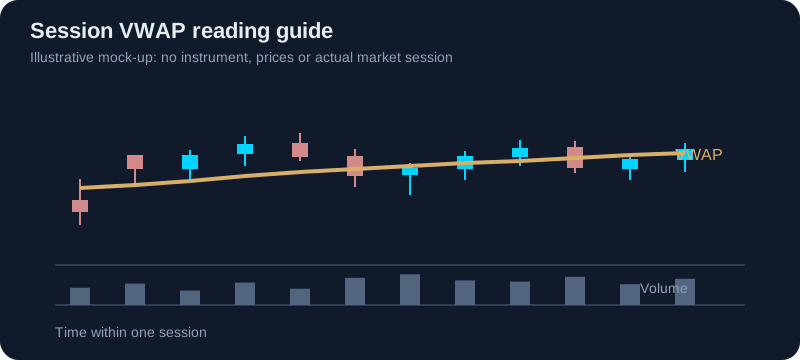
A line showing the average traded price weighted by volume within the current session.
What to look at
The price can be above or below VWAP, then cross it again. Volume bars show how much traded in each interval. This diagram is schematic, with no market prices.
What the evidence establishes
Above or below VWAP describes the relationship between current price and an average of all trades so far. It does not identify who traded.
What it cannot establish
VWAP is not an institution's acquisition cost, a support level, or a directional signal.
Observation exercise
On two trading days, record at 10:00 and 14:00 whether a liquid stock is above or below VWAP. Note each recrossing and compare a trending day with a choppy day.
When to stay away
Stay away from a trade whose only reason is that price crossed VWAP.
Limitations
This is an educational mock-up, not a Kite capture or an observed market session. A VWAP crossing alone does not identify a trader or predict the next move.
Primary sources and related research
Related research: The Opening Window Rule.