 AION
Research / Retail Investor Field Guide
Lesson 3 of 11 | Cash Market Participation
Volume and Delivery Percentage: What Changes Hands
Traded quantity counts shares exchanged during the session. Deliverable quantity is the portion reported for delivery rather than squared off intraday. Delivery percentage compares the two.
What to look at
An NSE delivery report labels quantity traded, deliverable quantity and the percentage. Check the security, series and trade date before calculating anything.
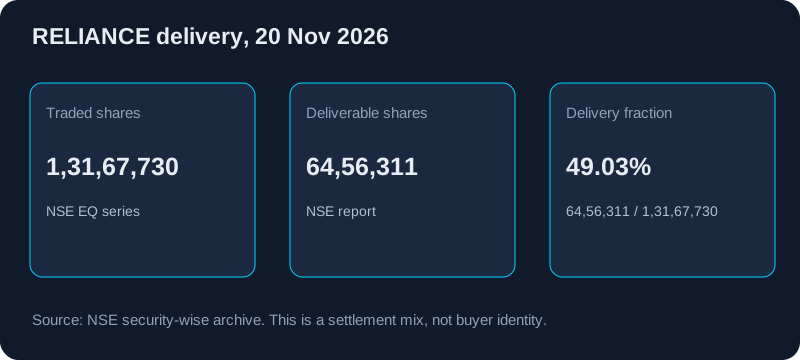
RELIANCE EQ, NSE security-wise price, volume and deliverable position file, 16 to 20 November 2026
| Trade date | Traded shares | Deliverable shares | Delivery % |
|---|---|---|---|
| 20-Nov-2026 | 1,31,67,730 | 64,56,311 | 49.03% |
| 19-Nov-2026 | 1,44,86,599 | 79,89,930 | 55.15% |
| 18-Nov-2026 | 1,82,28,940 | 1,04,76,168 | 57.47% |
| 17-Nov-2026 | 1,59,05,595 | 74,61,978 | 46.91% |
| 16-Nov-2026 | 76,53,528 | 36,19,563 | 47.29% |
What the evidence establishes
A larger deliverable share describes the settlement mix for that stock and day. It can be compared with price and volume over several dates.
What it cannot establish
It does not name the buyer or show whether a participant is accumulating. A buyer and seller both participate in every delivered trade.
Observation exercise
Choose one cash stock and record traded quantity, deliverable quantity and the exchange percentage on three dated reports. Divide deliverable by traded quantity and compare with the published percentage.
When to stay away
Stay away from an entry based only on one high delivery reading or an unexplained price move.
Limitations
One stock and one week do not establish a general pattern. The exchange fields describe a settlement outcome, not who accumulated or distributed shares.
Primary sources and related research
Related research: The FII-DII Headline Is Lagging.